


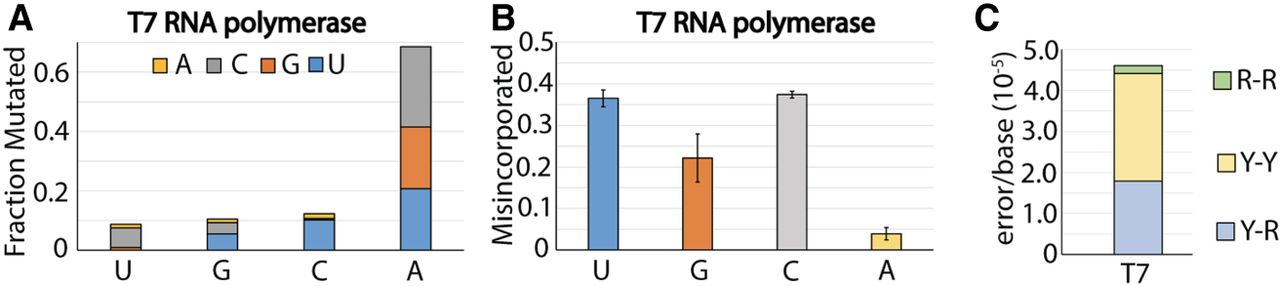
FIGURE 3.
Breakdown of substitution mutations of T7 and T7Y639F RNA polymerase. (A) Fraction of substitution error generated for each nucleotide by T7 RNA polymerase. Fractions are subdivided by the proportion of each misincorporated nucleotide adenine (yellow), cytosine (gray), guanine (orange), and uridine (blue). (B) Fraction of misincorporation for each nucleotide by T7 RNA polymerase. (C) Error rate for T7 RNA polymerase subdivided by transversion (yellow and green) and transition (blue) mutations.




