


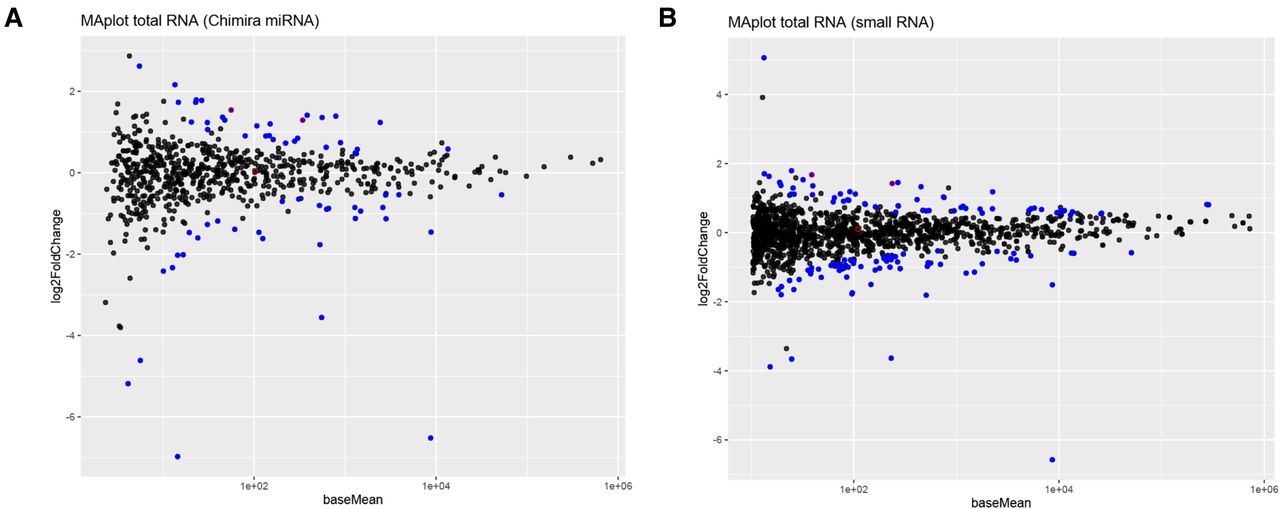
FIGURE 5.
miRNA and small RNA changes in Huh7.5 ADAR1 KO. (A) MA plot of DESeq2 results for miRNAs mapped by Chimira in total RNA samples. The plot shows results of differential expression analysis done by DESeq2. Significantly changed miRNAs (FC > 1.5, P-adj < 0.05) are in blue, unchanged miRNAs are in black. Edited miRNAs are marked with a red circle. (B) MA plot of DESeq2 results for small RNA sequencing mapped to the genome in total RNA samples. The plot shows results of differential expression analysis done by DESeq2. Significantly changed small RNAs (FC > 1.5, P-adj < 0.05) are in blue, unchanged small RNAs are in black. Edited small RNAs are marked with a red circle.




