


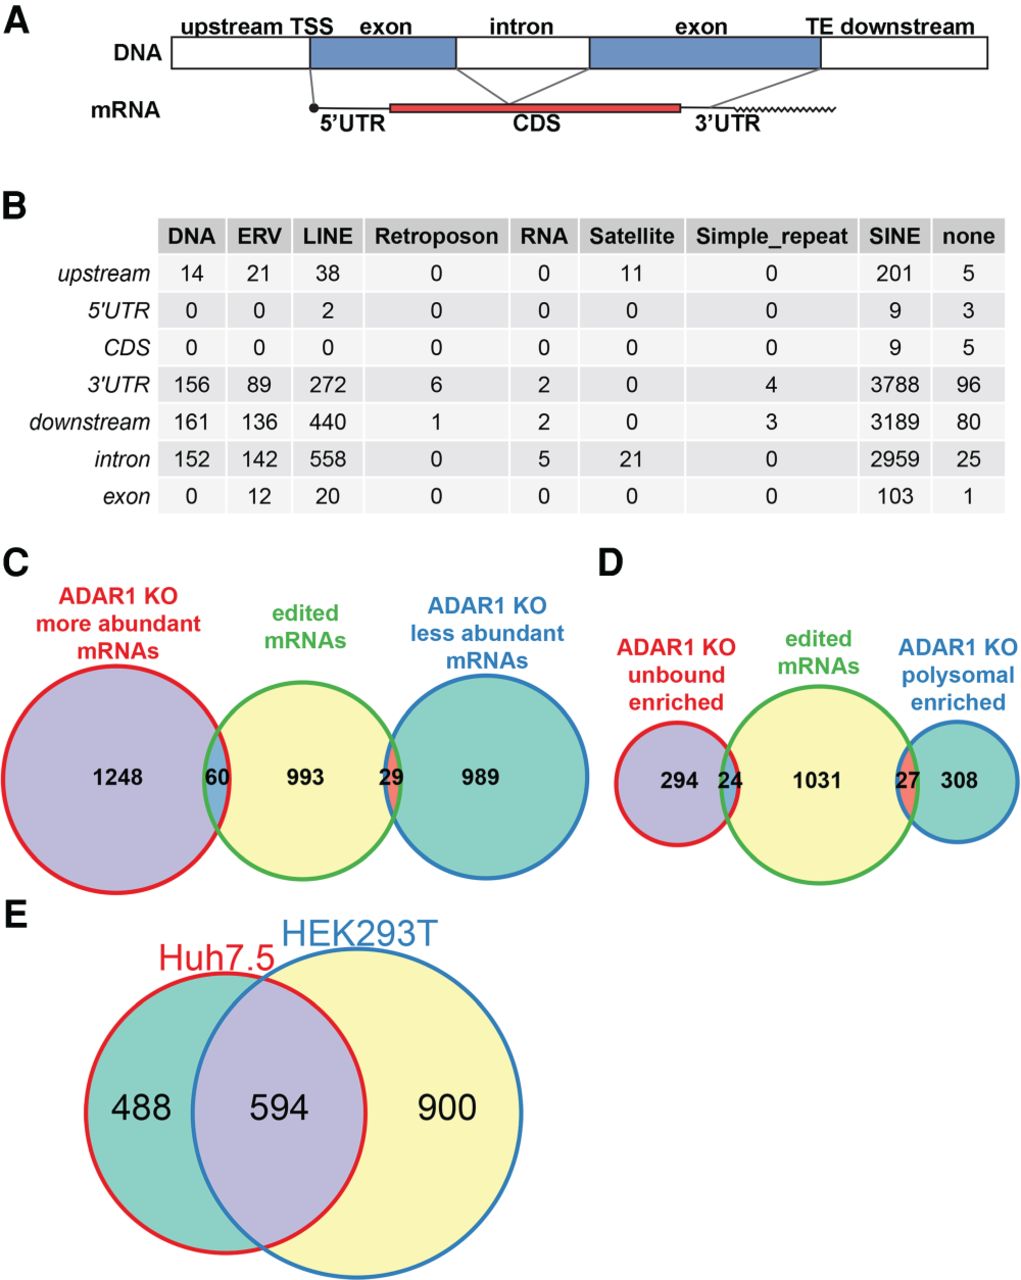
Edited position and their corresponding genes in Huh7.5 cell line. (A) A schematic depiction of used RNA/gene part annotations. On the top, there is the DNA composition of a hypothetical gene. Positions located between a database given gene start and a transcription start site (TSS) are annotated as “upstream.” Analogically, positions located after a database given TE up to the gene end are annotated as “downstream.” Annotations for “5′ UTR,” “CDS,” “3′ UTR,” and “intron” follow the database annotations. For transcripts without UTR and CDS annotations, a simple “exon” category was established. BiomaRt (version 2.38.0) was used to assign annotations. (B) A table of edited sites identified in Huh7.5 ADAR1 KO to Huh7.5 wt total RNA comparison. The table summarizes all identified edited positions based on their position in the transcript and the type of repetitive element they are part of. Repetitive elements were assigned to positions using Repbase v. 23.11. Positions not located in a database annotated repetitive element are grouped in “none” column. (C) Venn diagram of edited mRNA abundance. The diagram shows number of edited mRNAs belonging to unique genes which are differentially abundant in Huh7.5 ADAR1 KO cells compared to Huh7.5 wt. (D) Venn diagram of edited mRNA polysome loading. The diagram shows number of edited mRNAs belonging to unique genes which exhibit altered polysome loading in Huh7.5 ADAR1 KO cells in comparison to Huh7.5 wt. (E) Venn diagram of unique genes with edited transcripts in Huh7.5 and HEK293T cell lines. The diagram shows that about half of the genes with edited transcripts in Huh7.5 overlap with the set of genes with edited transcripts in HEK293T identified by Chung et al. (2018).




