


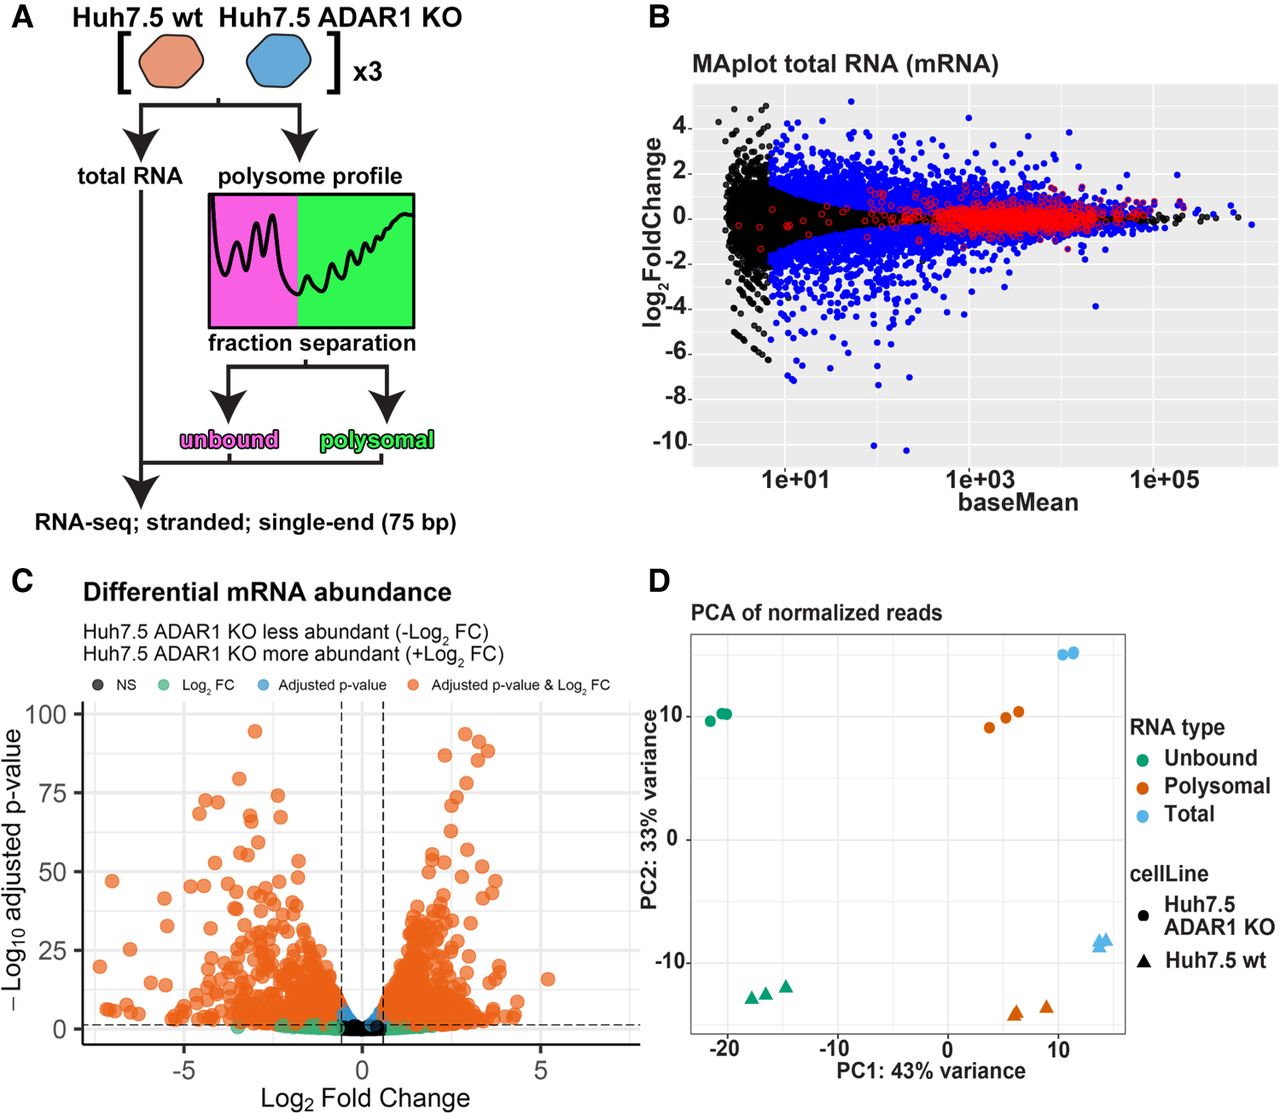
RNA-seq and differential expression in RNA samples of Huh7.5 wt and Huh7.5 ADAR1 KO. (A) Schematic depiction of analyzed RNA types. Total RNA and RNA from the polysome profiles were isolated from both Huh7.5 wt and Huh7.5 ADAR1 KO cell lines. The polysome profiles were dissected in two fractions: all from the loading peak up to the monosomal 80S peak (unbound) and the rest (polysomal). All six sample types were subjected to RNA-seq analysis. (B) MA plot of DESeq2 results for mRNAs in total RNA samples. The plot shows results of differential expression analysis done by DESeq2. Significantly changed genes (FC > 1.5, P-adj < 0.05) are in blue, unchanged genes are in black. Edited genes are marked with a red circle. (C) Volcano plot of differential mRNA abundance. The plot shows DESeq2 results for mRNA changes in total RNA samples. Threshold for FC is set to 1.5, and threshold for adjusted P-value is set to 0.05. Genes passing both thresholds are in orange, genes passing only the FC threshold are in green, genes passing only the adjusted P-value are in blue, genes not passing any threshold are in gray. (D) Principal component analysis of all mRNA sequencing samples. Counts for the DESeq2 analysis were normalized by the DESeq2 rlog. In the plot, along the PC1 axis, different mRNA types can be separated (unbound, polysomal, and total), and along the PC2 axis, the different cell lines can be separated (Huh7.5 wt and Huh7.5 ADAR1 KO).




