


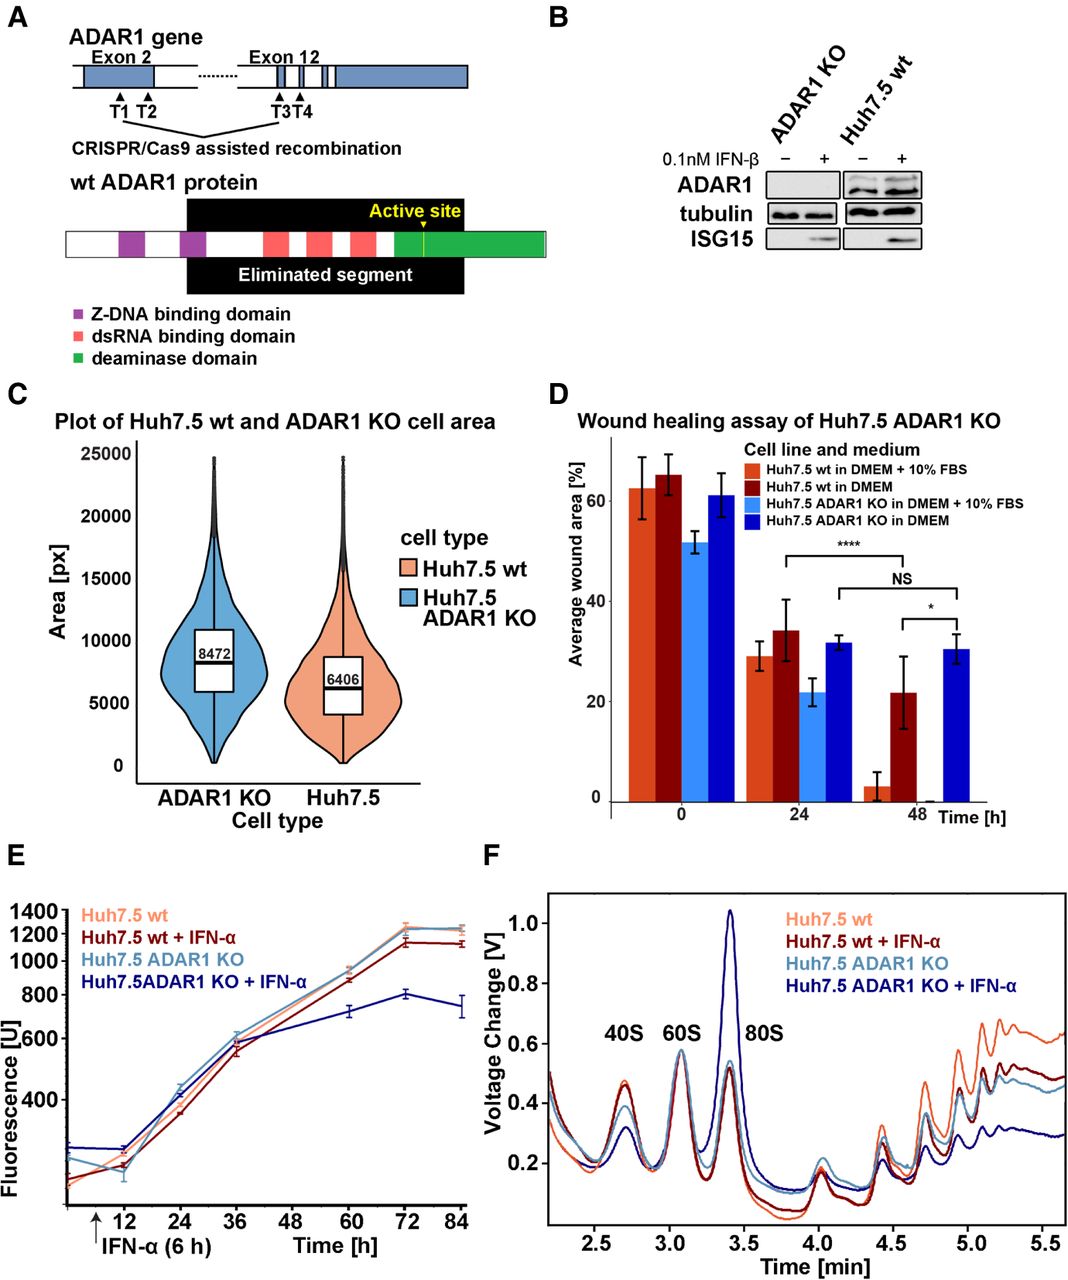
Characterization of Huh7.5 ADAR1 KO phenotype. (A) Schematic depiction of CRISPR/Cas9-directed ADAR1 gene recombination in Huh7.5 cell line. The recombination between target sequences (marked T1–T4) in the region coding exon 2 and exon 12 of ADAR1 mRNA is designed to eliminate a significant portion of the ADAR1 gene. The wild-type (wt) variant of the ADAR1 protein is shown with its functional domains: two Z-DNA binding domains (purple), three dsRNA-binding domains (pink), and deaminase domain (green), including the active site (yellow). The recombination eliminates all three dsRNA-binding domains and the majority of the deaminase domain with the active site. The depiction is based on the longest transcript variant of ADAR1, ID: NM_001111.4. (B) Western blot analysis of ADAR1 KO efficiency. Huh7.5 wt and Huh7.5 ADAR1 KO cell lines were grown for 24 h in DMEM + 10% FBS with or without 0.1 nM IFN-β up to full confluence and harvested. Lysate samples containing an equal amount of proteins (40 µg) were used for the western blot analysis. The complete loss of ADAR1 bands (both for p110 and p150) in the Huh7.5 ADAR1 KO cell line can be observed as well as the preservation of ISG15 expression upon IFN treatment. ADAR1 KO was also confirmed by PCR and sequencing of the target region. (C) Quantification of size increase of Huh7.5 ADAR1 KO cells compared to Huh7.5 wt cells using fluorescent microscopy. We stained both cell types with WGA (membrane) and DAPI (nuclei) and used this staining to calculate the area covered by individual cells. The graph combines a violin plot, which shows the frequency of cell areas measured for Huh7.5 wt (red) and Huh7.5 ADAR1 KO (blue), and a box plot, which shows the first quartile, median, and the third quartile. The median values for each cell line are stated in the box plot. The graph shows that Huh7.5 ADAR1 KO cells area distribution is shifted to larger sizes. The quantification method is described in the Materials and Methods section. (D) Wound healing assay of Huh7.5 wt and Huh7.5 ADAR1 KO cells. The initial wound was done just to a confluent monolayer of Huh7.5 wt and Huh7.5 ADAR1 KO cells. The graph shows the size of the wound at 0, 24, and 48 h (n = 6, significance of differences was assessed by paired and two-sample T-test). In the presence of FBS, Huh7.5 wt and Huh7.5 ADAR1 KO cells healed the wound at a similar rate. Without FBS, the wound in Huh7.5 ADAR1 KO monolayer stayed bigger than in Huh7.5 wt; NS P > 0.05; (*) P < 0.05; (****) P < 0.0001. (E) Growth properties of Huh7.5 wt and Huh7.5 ADAR1 KO cells. The growth was measured by the resazurin assay. Both cell types were grown in a regular medium (DMEM + 10% FBS). IFN was added 6 h postseeding. In a regular medium (DMEM + 10% FBS), the growth rates for Huh7.5 wt (red) and Huh7.5 ADAR1 KO (blue) were similar. Huh7.5 ADAR1 KO cells stopped their growth as soon as 24 h upon IFN addition and died by 72 h (dark blue). Error bars for each data point show the standard deviation of the triplicate measured. (F) Polysome profile analysis of the Huh7.5 wt and the derived ADAR1 KO cells under normal and IFN conditions. Polysomes were analyzed from cells upon 24 h of 0.1 nM IFN-α treatment. Data are normalized to 60S peak. There is a shift from the polysomal fraction in favor of the ribosomal 80S peak in the IFN-treated Huh7.5 ADAR1 KO (dark blue) compared to IFN-treated Huh7.5 wt (dark red).




