


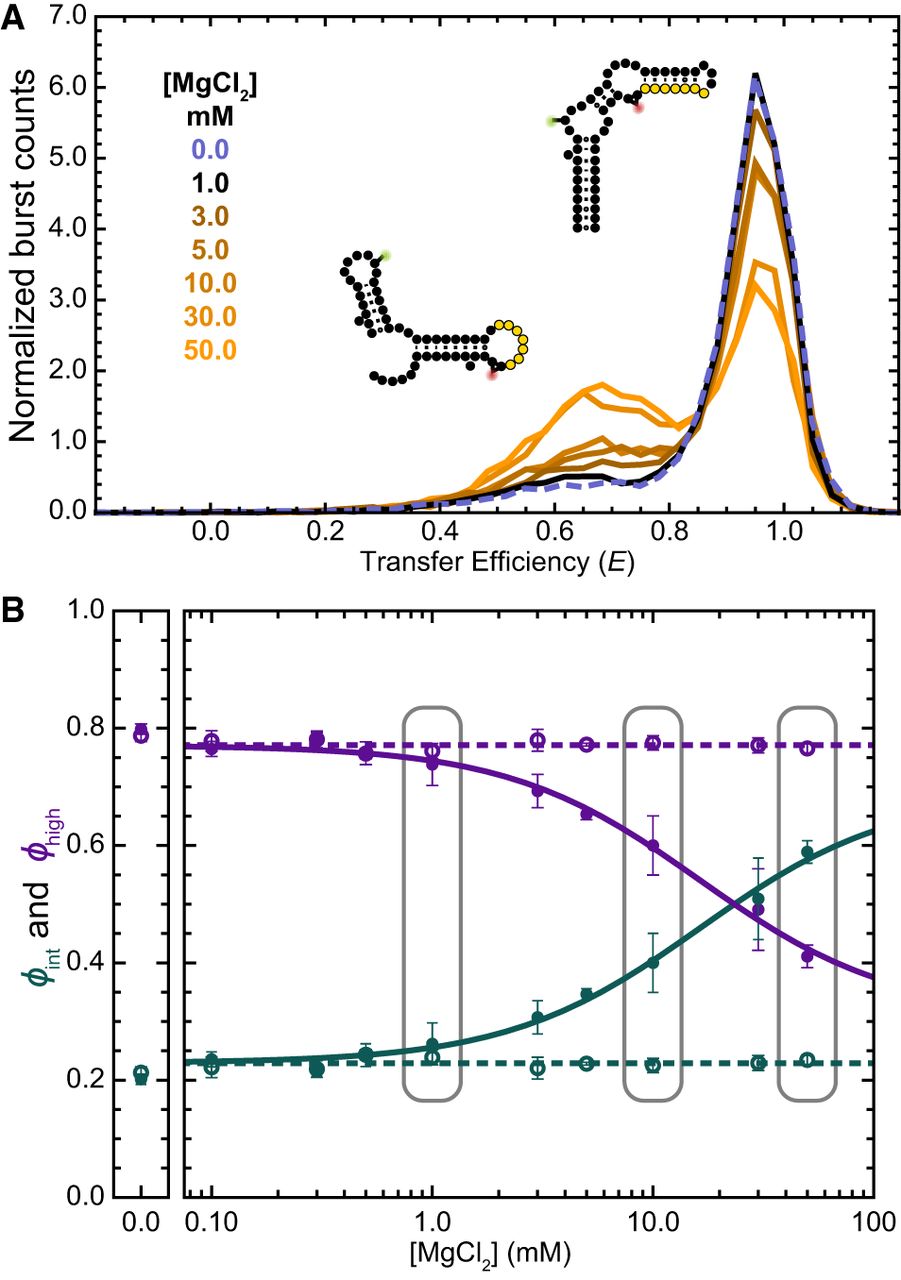
Impact of MgCl2 on the conformations of 3′X55. (A) Representative transfer efficiency histograms of 3′X55 at various concentrations of MgCl2. (B) Relative abundance, ϕ, values derived from fully equilibrated measurements (filled circles) show that elevated concentrations of MgCl2 shift the conformational equilibrium toward the intermediate transfer efficiency population. These data are globally fit to a standard binding equation (solid line), yielding an apparent Mg2+ dissociation constant of [Mg2+]1/2 = 16 ± 3 mM. The ϕ values associated with nonequilibrated measurements conducted immediately after the addition of MgCl2 (open circles) are experimentally indistinguishable from fully equilibrated measurements under baseline experimental conditions (dashed line). Subsequent time-resolved measurements were conducted at select MgCl2 concentrations (gray boxes).




