


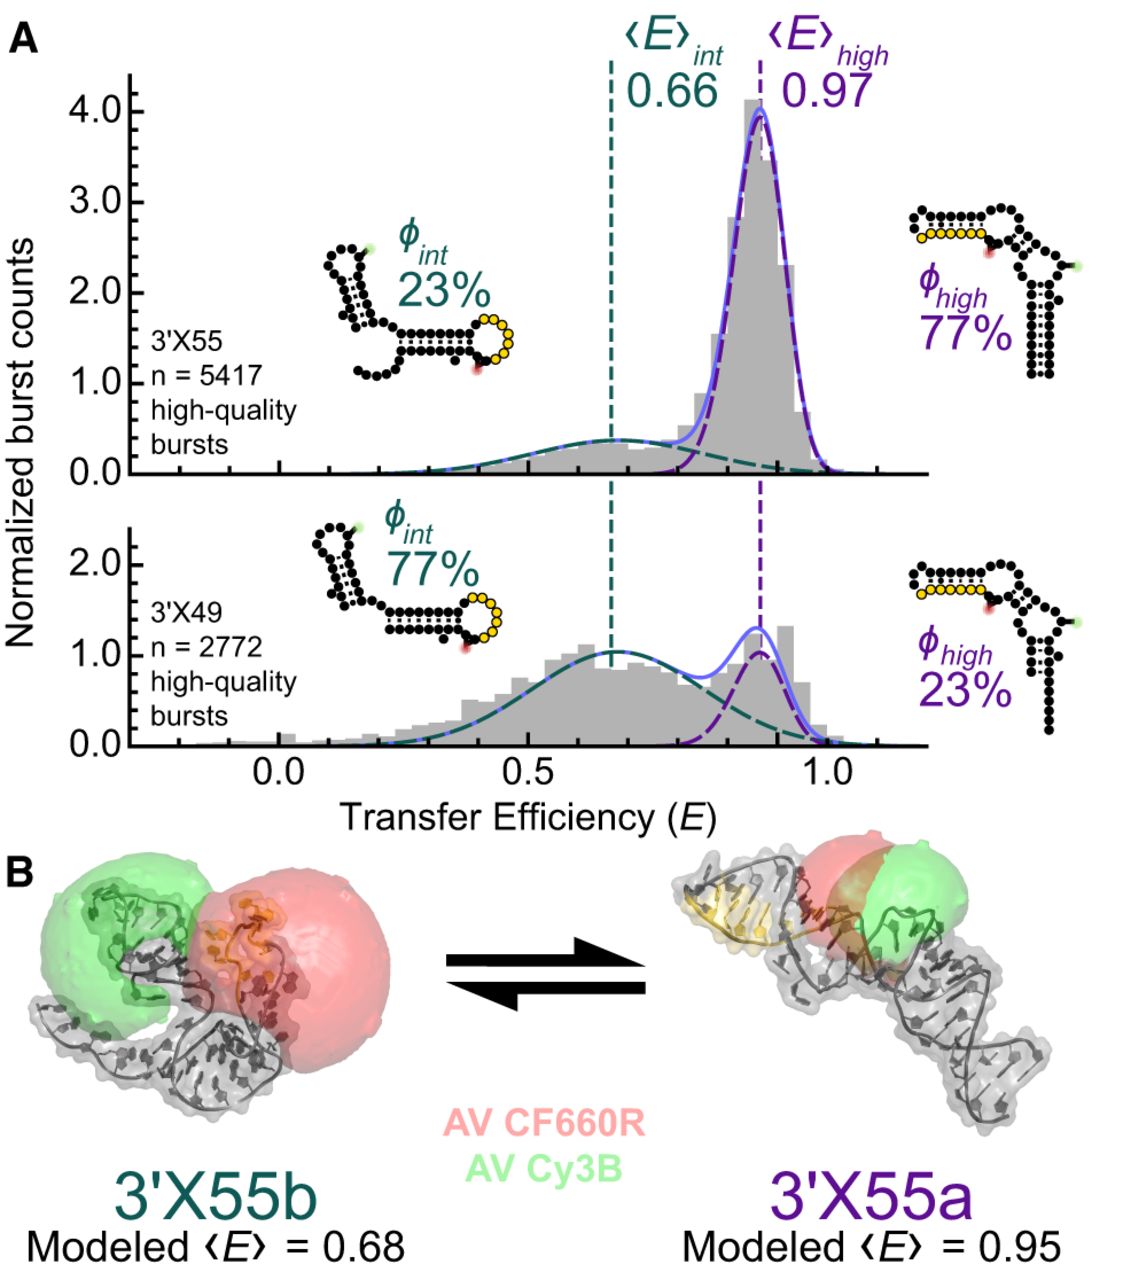
FIGURE 4.
Conformations of 3′X55. (A) Representative transfer efficiency histograms comprised of high-quality bursts associated with either 3′X55 (top) or 3′X49 (bottom) are jointly fit to a sum of two peaked functions to determine the mean transfer efficiency, 〈E〉, and relative abundance, ϕ, of each species. (B) Molecular representations of the three-dimensional models of 3′X55b (left) and 3′X55a (right) showing the AV associated with the donor and acceptor fluorophores and the modeled transfer efficiencies derived from them.




