


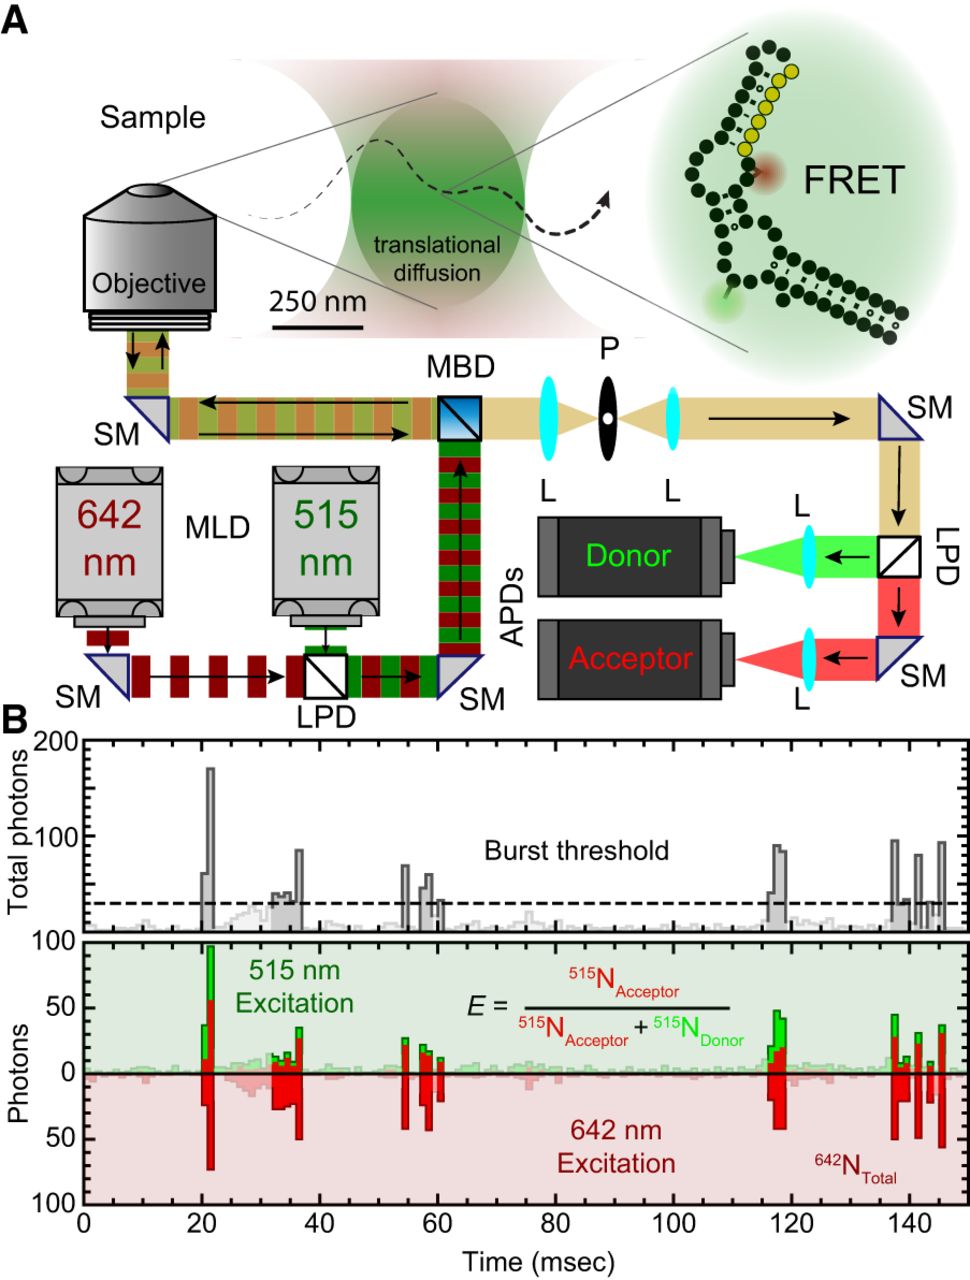
Overview of single-molecule FRET measurements. (A) Schematic representation of a single-molecule microscope system comprised of monochromatic laser diodes (MLDs), silver mirrors (SMs), long-pass dichroic (LPD), a multiband dichroic (MBD), an objective, achromatic lenses (L), a confocal pinhole (P), and avalanche photodiode detectors (APDs). (B) Detected photons are partitioned into 1.0 msec time bins based on their arrival time. Any time bin with a total number of photons (top) >30 (black dashed line) is considered a burst. These photons are partitioned based on the excitation source that was ON when the photon was detected (bottom). This allows us to calculate the transfer efficiency (E) of bursts originating from FRET-active molecules, which contain one active donor and one active acceptor fluorophore.




