


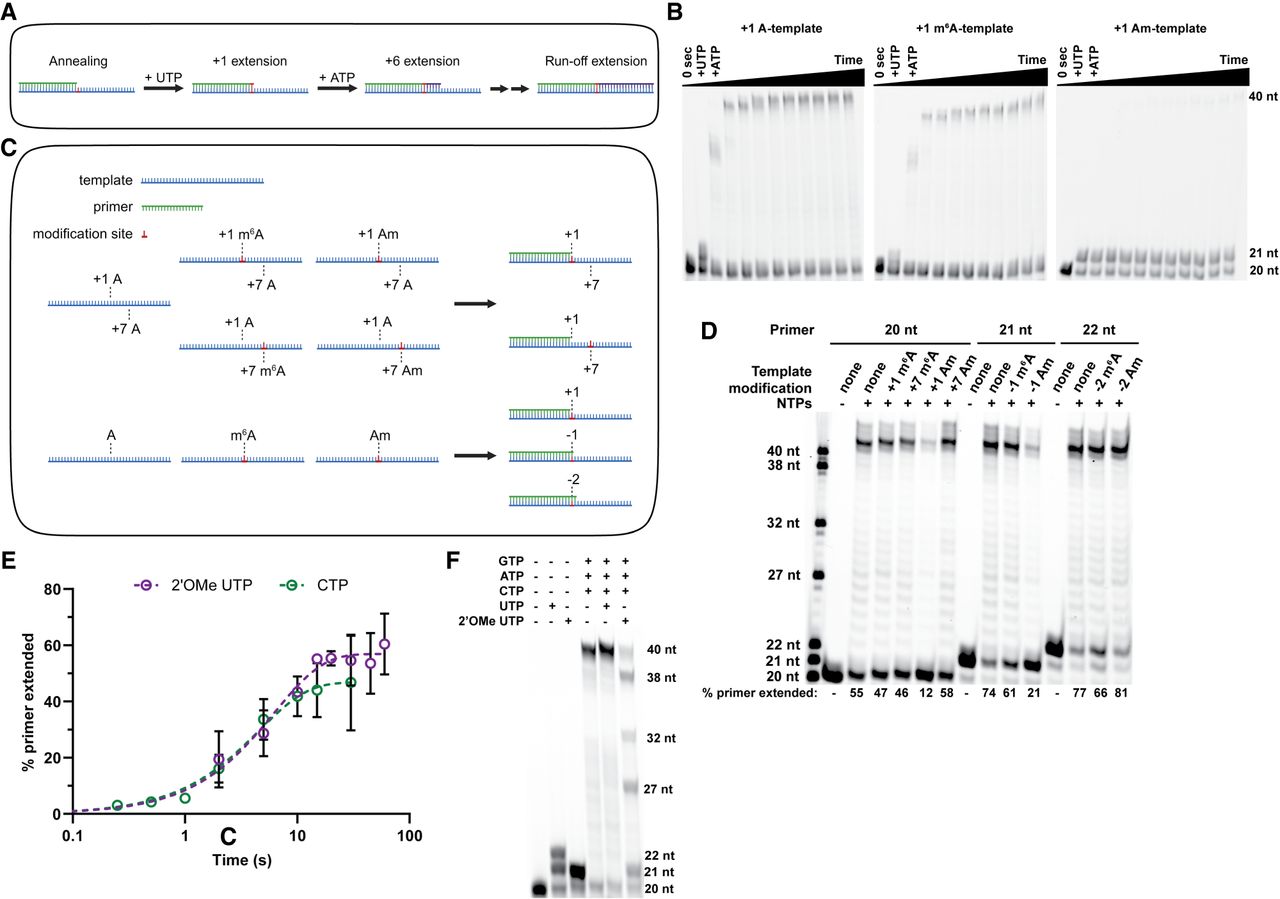
Modification location relative to transcription start site impacts RTC processivity. (A) Visual representation of double-mixing experiment performed in B, with RNA primer (green) annealed to RNA template (blue) being extended by the addition of UTP (red) and ATP (purple). (B) Time course of double-mixing experiment performed for the indicated template by the addition of UTP for 30 sec (A and m6A templates) or 1 h (Am template), followed by the addition of ATP up to 1 h. (C) Visual representation of RNA templates (blue) and RNA primers (green) used in C, showing modification sites relative to primer annealing and transcription start sites. (D) End point primer extension reactions performed by incubation of all NTPs with RNA duplexes composed of either unmodified, +1 m6A, +7 m6A, +1 Am, or +7 Am templates annealed to either a 20, 21, or 22 nt fluorescent primer for 5 min. Numbers beneath gel lanes represent the percentage of total RNA extension for a single reaction. Notably, when these reactions were run on a rapid quench, we observed the formation of 27 nt and longer products on unmodified and +7 m6A templates, but only up to 26 nt products on a +7 Am template, indicating that the RTC transiently pauses on Am under full elongation conditions. (E) Comparison of single-nucleotide addition kinetics for the addition of 2′OMe UTP or CTP using an unmodified template. (F) End point primer extension reactions performed by incubation of indicated NTPs with RNA duplexes composed of the unmodified template with 20 nt fluorescent primer for 10 min.




