


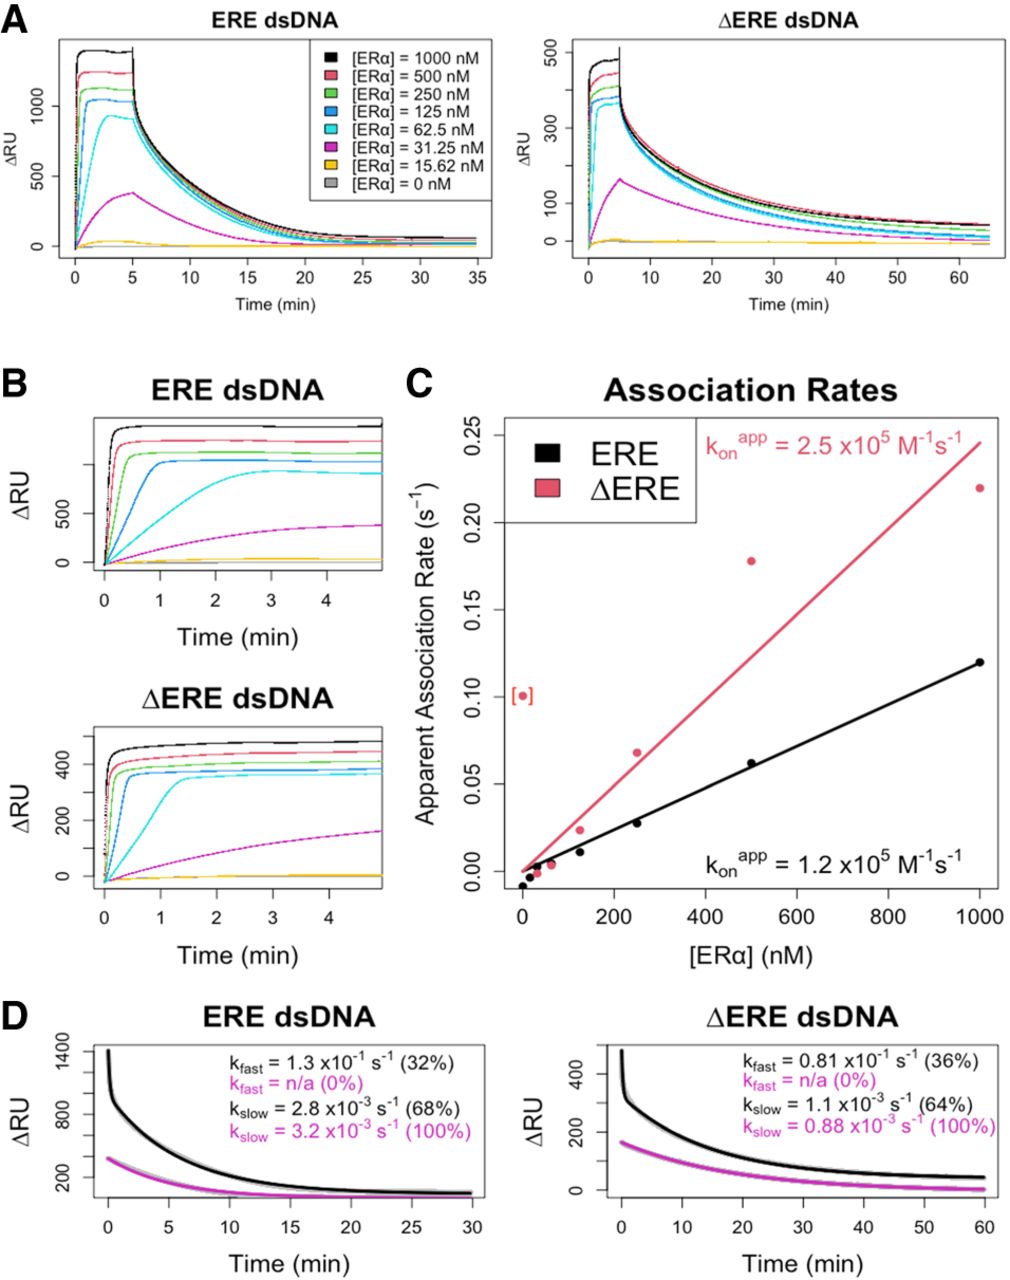
Surface plasmon resonance confirms multiphasic ERαDBD-Ext-dsDNA binding kinetics. (A) Normalized SPR traces are shown for the association and dissociation phases. The change in RU signal after ERαDBD-Ext injection (ΔRU), which excludes changes observed in the empty flow cell, is shown as a function of time postinjection. Legends
indicate the concentration of ERαDBD-Ext used during protein injection. Lines are data, not regression fits. (B) ERαDBD-Ext ligand association curves. SPR association phase curves, taken from A with the same color scheme. (C) Association rate analysis. Association curves from B had their initial slopes normalized to their signal dynamic range to calculate their apparent association rates (see Materials
and Methods). Plots of apparent initial association rates versus protein concentrations were fit with zero-intercept linear
regression to calculate apparent initial association rate constants ( ). Dots are data and solid lines are linear regression fits. Bracketed data point is an outlier from the initial slope quantification
of the 16 nM association curve in B, which has negligible signal dynamic range. (D) Dissociation rate analysis. SPR dissociation phase curves, taken from A, with the same color scheme. Two key protein concentrations (1 µM and 30 nM) are shown. Data were fit with biexponential
regression (Equation 5) to determine rate constants. Gray dots are data and solid black/purple lines are regression fits; data points are mostly
obscured by regression lines. Percent contributions of fast versus slow components to the biexponential curve are in parentheses.
All SPR data in this figure are from a single experiment per ligand.
). Dots are data and solid lines are linear regression fits. Bracketed data point is an outlier from the initial slope quantification
of the 16 nM association curve in B, which has negligible signal dynamic range. (D) Dissociation rate analysis. SPR dissociation phase curves, taken from A, with the same color scheme. Two key protein concentrations (1 µM and 30 nM) are shown. Data were fit with biexponential
regression (Equation 5) to determine rate constants. Gray dots are data and solid black/purple lines are regression fits; data points are mostly
obscured by regression lines. Percent contributions of fast versus slow components to the biexponential curve are in parentheses.
All SPR data in this figure are from a single experiment per ligand.




