


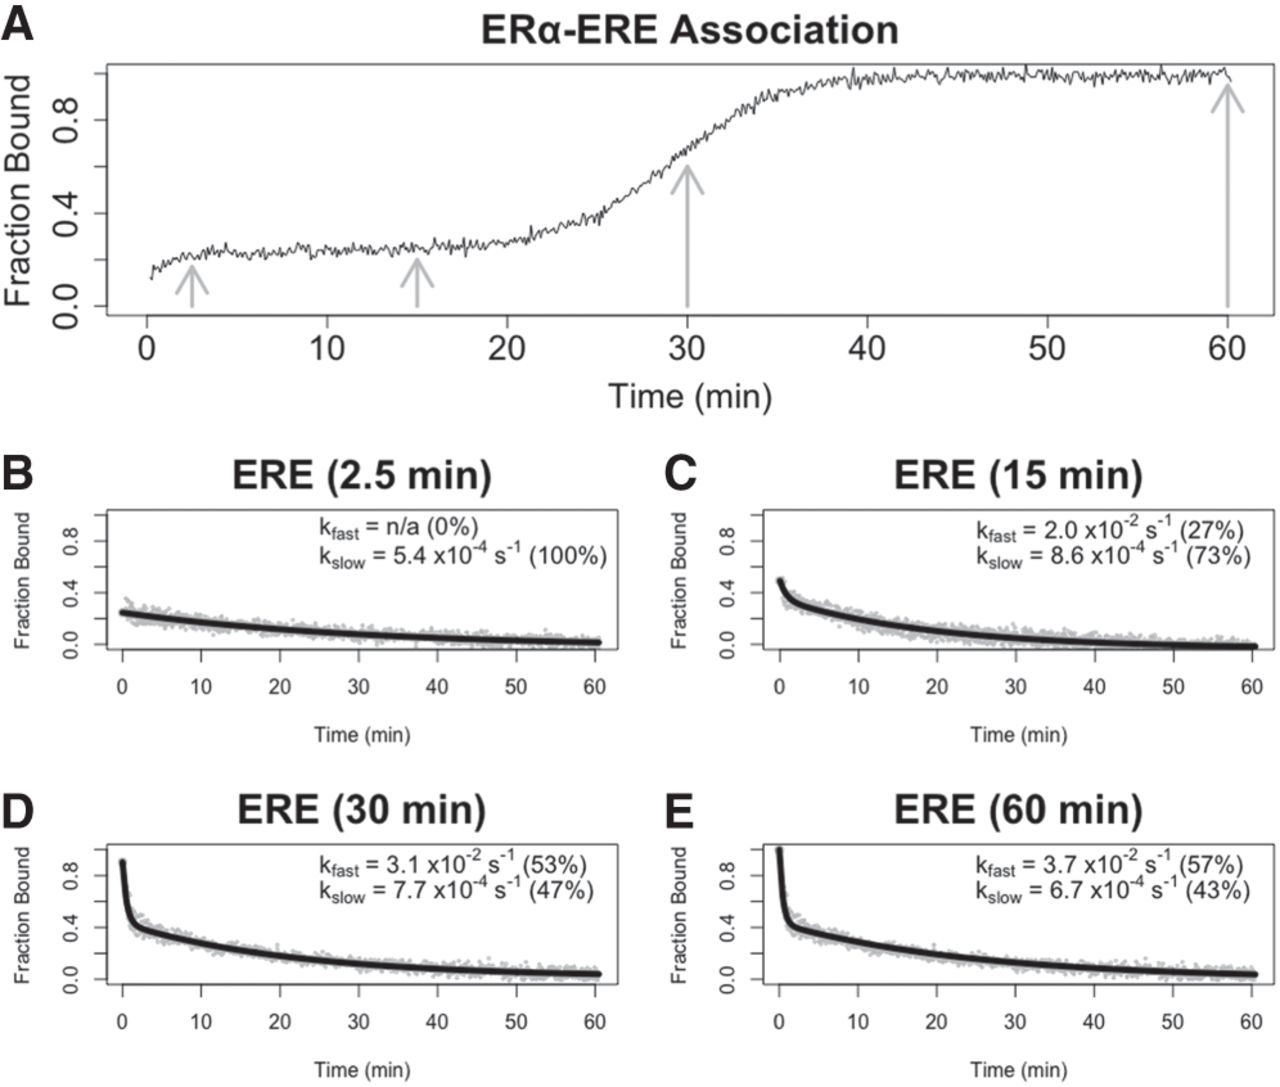
The more stable complex state forms first during multiphasic ERαDBD-Ext ligand association. (A) Normalized ERαDBD-Ext association curve. Normalized association curve of 30 nM ERαDBD-Ext and 2 nM ERE dsDNA, taken from Figure 4A. Gray arrows correspond to incubation times before competitor addition in B–E experiments. (B–E) Dissociation curves from FPCD experiments in which a competitor was added after variable protein–ligand incubation times. FPCD experiments (see Fig. 2A) were performed for the ERαDBD-Ext–ERE interaction using 2 nM ligand, 10 µM competitor, and 30 nM protein; protein–ligand reactions were incubated for 2.5 min (B), 15 min (C), 30 min (D), or 60 min (E) before competitor addition. Anisotropy traces were normalized to the internal controls to give “Fraction Bound” over time, and then normalized data were fit with biexponential regression (Equation 5) to determine rate constants. Gray dots are data points and solid black lines are regression fits from single experiments. Percent contributions of fast versus slow components to the biexponential curve are in parentheses. Rate constant values are from single independent experiments.




