


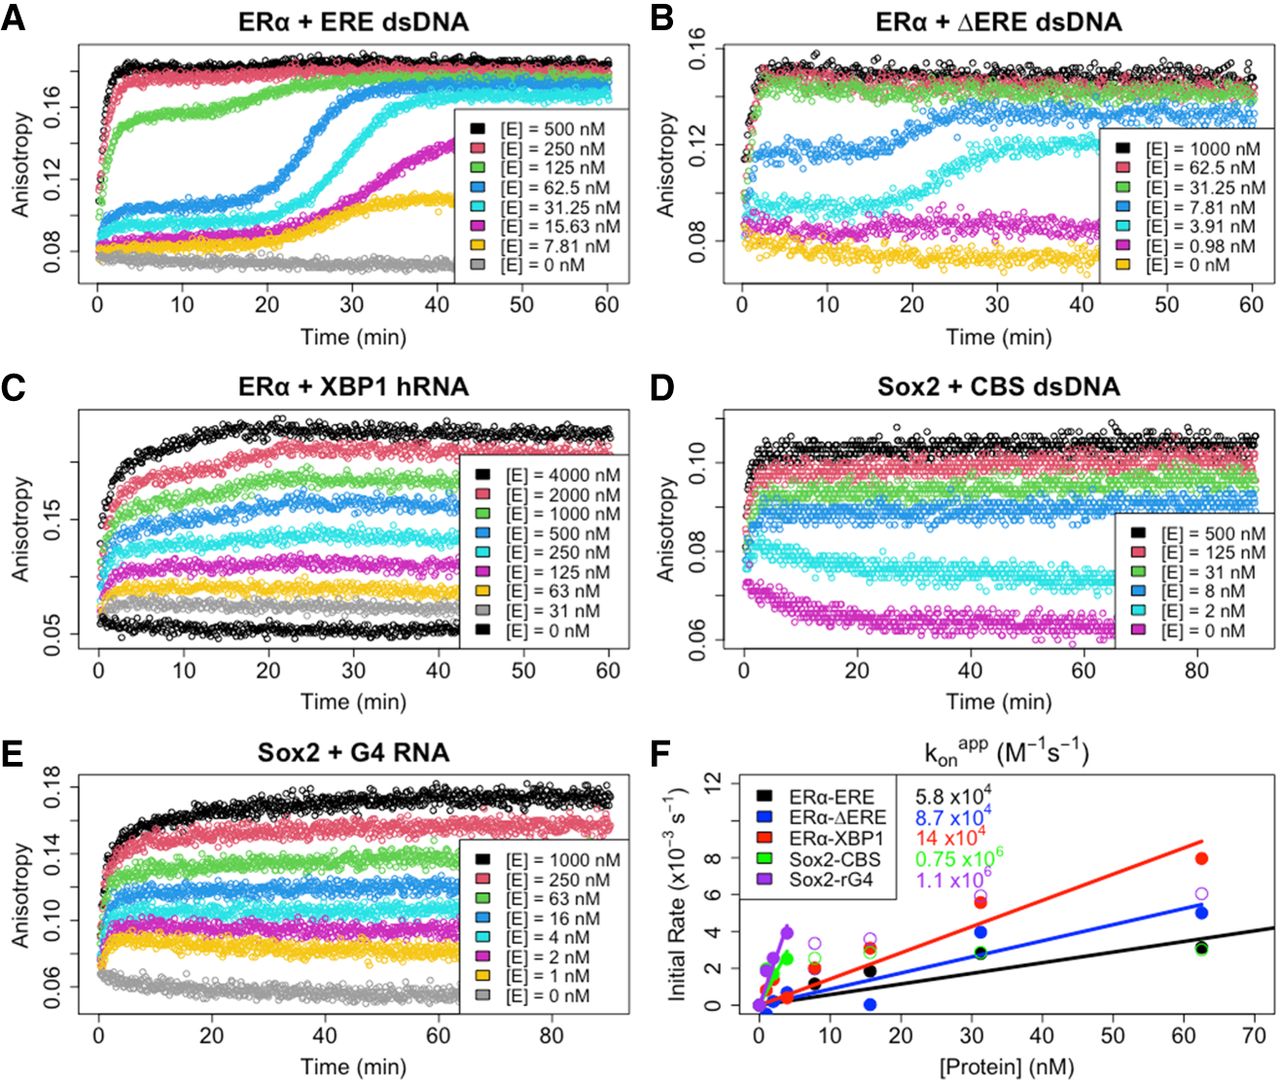
ERαDBD-Ext, but not Sox2HMG, exhibits multiphasic target DNA association. (A–E) FP-based association curves. Protein–ligand reactions were prepared after thermal equilibration (4°C), and anisotropy was
monitored over time immediately after protein addition to quantify association kinetics. Ligand concentrations were 5 nM,
and protein concentrations [E] are indicated. Data are from single representative experiments (of one to three per protein–ligand
interaction). The first 10–45 min of association data were subjected to regression with an equation for monophasic (Equation
3) or biphasic (Equation 4) association; the regression fits are shown in Supplemental Figure S3. (F) Association rate constant analysis. Apparent initial association rates were determined with smoothing spline regression
(see Materials and Methods) and are plotted as a function of protein concentration. Each interaction has an initial linear
component, followed by a plateau in apparent association rate at higher protein concentrations, which corresponds to the incomplete
association curves seen at higher protein concentrations because of methodological limitations. Apparent association rates
from these linear stages were used for zero-intercept linear regression to calculate apparent association rate constants ( ). Filled circles are data points used for linear regression, open circles are data points excluded from linear regression,
and solid lines are linear regression fits. Rate constants are reported with any error in Table 1.
). Filled circles are data points used for linear regression, open circles are data points excluded from linear regression,
and solid lines are linear regression fits. Rate constants are reported with any error in Table 1.




