


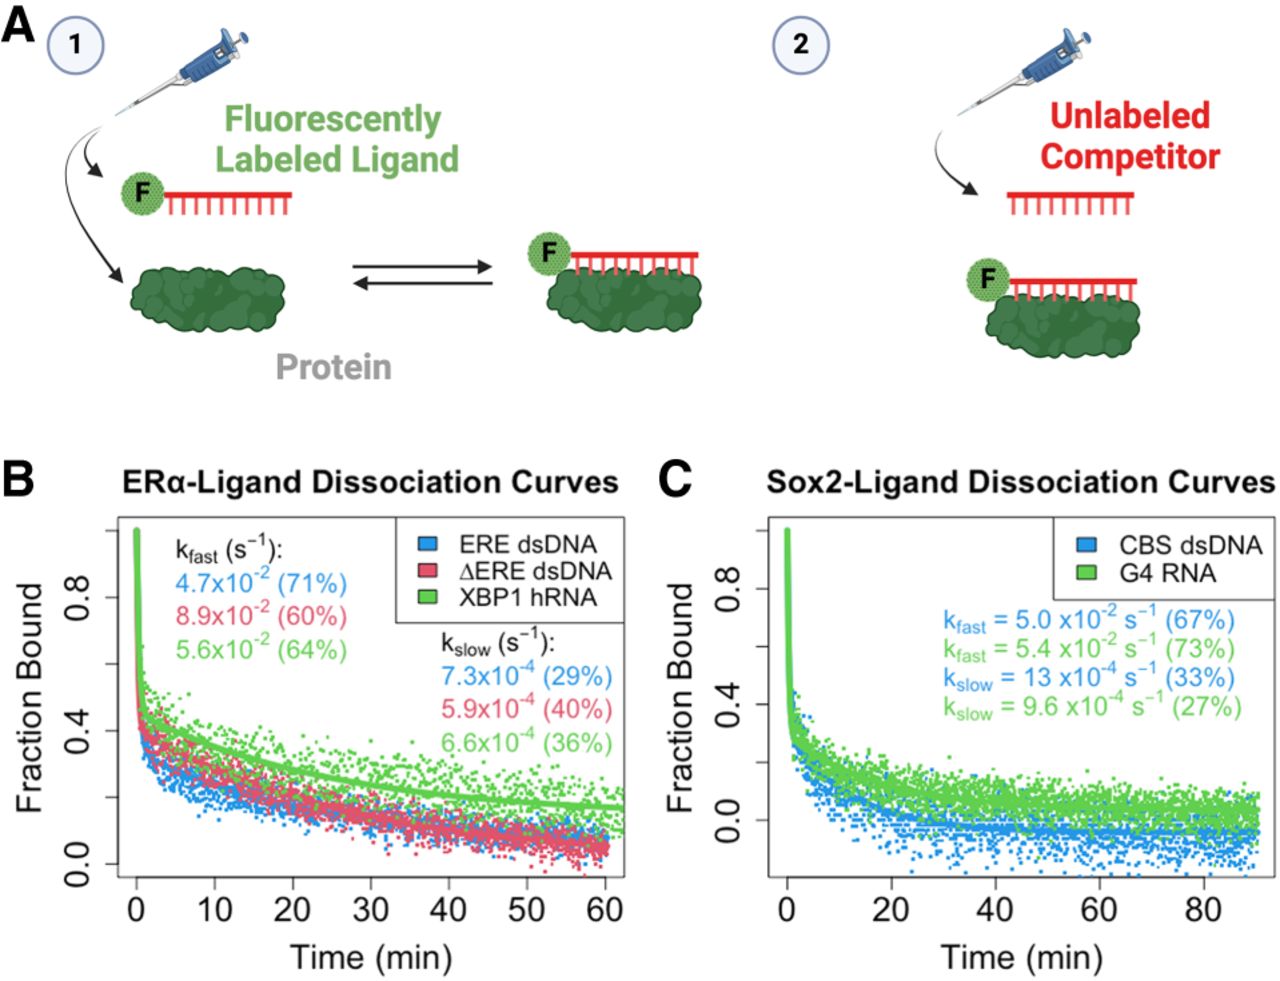
ERαDBD-Ext and Sox2HMG exhibit multiphasic ligand dissociation. (A) Graphical summary of FPCD experiments. (1) Fluorescently labeled polynucleotide is mixed with protein and incubated at 4°C for a variable amount of time, and then (2) an excess of unlabeled polynucleotide (i.e., competitor) is added to the protein–ligand reaction and polarization is monitored over time (at 4°C) to observe protein–ligand dissociation kinetics. (B,C) Dissociation curves from FPCD experiments. FPCD experiments (A) were performed using 5 nM ligand, 10 µM competitor, and 100–500 nM protein; protein–nucleic acid–binding reactions were incubated long enough to reach equilibrium before competitor addition. Anisotropy traces were normalized to the internal controls to give “Fraction Bound” over time, and then normalized data were fit with biexponential regression (Equation 5) to determine rate constants. Dots are data points and solid lines are regression fits from a single experiment for each ligand. Rate constants and (in parentheses) the percent contributions of fast versus slow components to the biexponential regression are reported with error in Table 1.




