


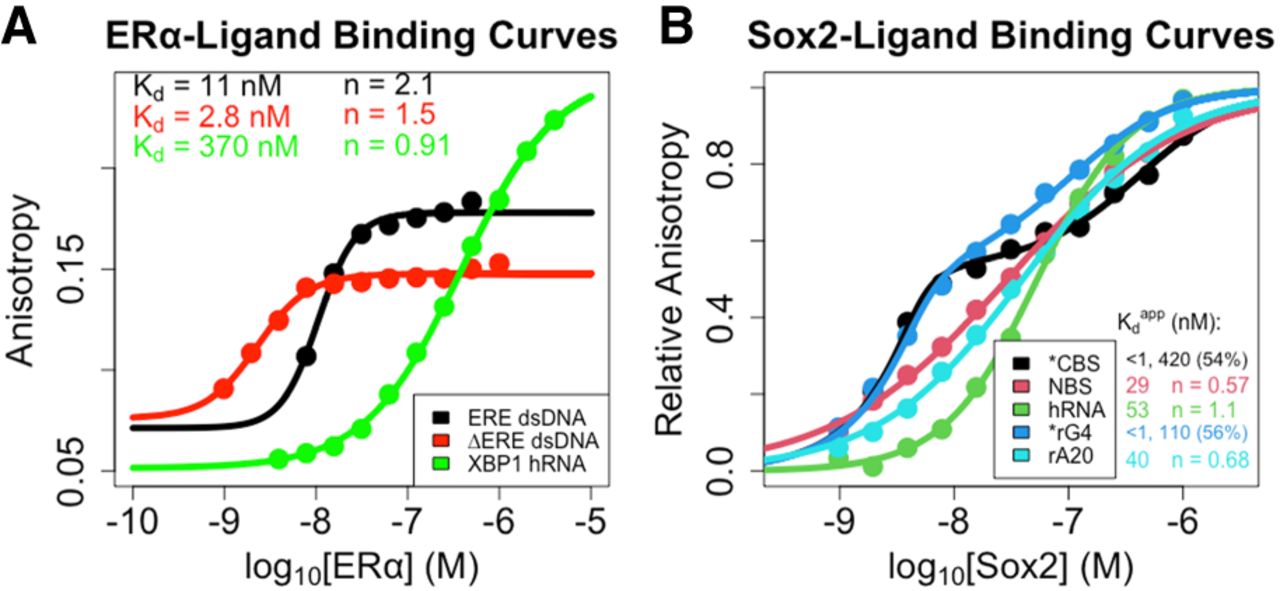
(A) ERαDBD-Ext- and (B) Sox2HMG-ligand-binding affinities. Equilibrium (end point) anisotropy values are plotted as function of protein concentration. Equilibrium
data were fit to the Hill binding equation (Equation 1) or two-transition binding equation (Equation 2) via regression on linear axes to determine the apparent equilibrium dissociation constants ( ) and Hill coefficients (n). Values for
  are in units of nanomolarity (nM). Dots are data points, and solid lines are regression fits. Data are from a single experiment
for each ligand, and binding constant values are the average of independent experiments (one to three per interaction; see
Table 1 for error analysis). We note that the ΔERE
are in units of nanomolarity (nM). Dots are data points, and solid lines are regression fits. Data are from a single experiment
for each ligand, and binding constant values are the average of independent experiments (one to three per interaction; see
Table 1 for error analysis). We note that the ΔERE  is approximately half the ligand concentration for the assay, suggesting that the true Kd may be even lower, and that the apparent Hill coefficient (n) may be slightly inflated by the anomalous tight-binding curve. Thus, we make no assertion of positive cooperativity for
the ERαDBD-Ex–ΔERE interaction. (*) Two-transition binding curves with
is approximately half the ligand concentration for the assay, suggesting that the true Kd may be even lower, and that the apparent Hill coefficient (n) may be slightly inflated by the anomalous tight-binding curve. Thus, we make no assertion of positive cooperativity for
the ERαDBD-Ex–ΔERE interaction. (*) Two-transition binding curves with  values shown alongside the proportion of the binding signal dynamic range attributable to the lower
  ; no applicable Hill coefficient values.




