


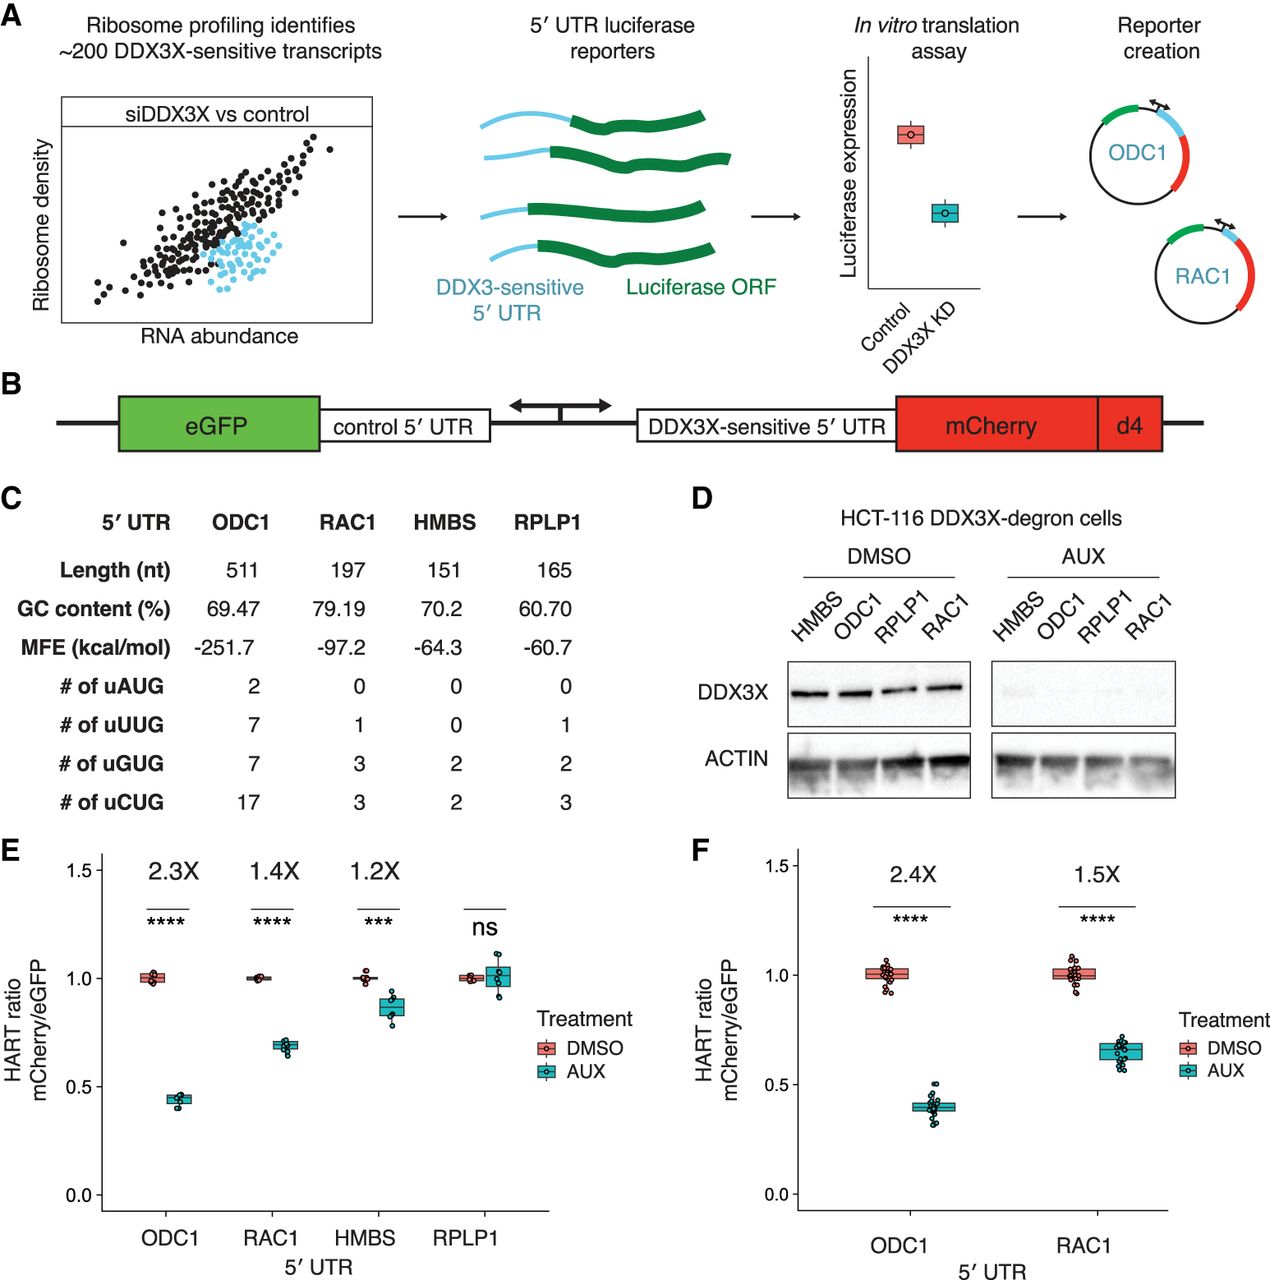
The HART uses DDX3X-sensitive 5′ UTRs to measure the translational activity of DDX3X. (A) Selection of DDX3X-sensitive 5′ UTRs for HART. Validated DDX3X-sensitive 5′ UTR from prior ribosome profiling and in vitro translation as well as negative controls were cloned into the HART reporter. (B) Diagram of HART. HART is constructed around a bidirectional promoter, with one arm directing the transcription of a control 5′ UTR and eGFP, and the other arm featuring a DDX3X-sensitive 5′ UTR followed by mCherry. An ornithine decarboxylase (ODC) degron (d4) shortens the mCherry half-life. The HART ratio (mCherry/eGFP) can be used to measure the translational activity of DDX3X. (C) Table of features for the 5′ UTRs from C. Features cataloged include length, GC content, RNA minimum free energy (MFE) prediction using the ViennaRNA Package (Lorenz et al. 2011), and the number of upstream AUGs and near-cognate codons. (D) Western blot for cells in A. HCT116 degron cells were treated with either auxin or DMSO, and then lysates were collected and resolved by SDS-PAGE and used for western blotting with antibodies against actin and DDX3X. (E) HART ratio in HCT116 degron cells analyzed with flow cytometry. HCT116 degron cells were lentivirally transduced with HART constructs with indicated 5′ UTRs upstream of mCherry. After 48 h from the addition of either DMSO or auxin, which induces degradation of endogenous DDX3X, the fluorescent signal of cells was measured by fluorescent cytometry. The HART ratio (mCherry/eGFP) was calculated for each cell and averaged across replicate wells. Data were obtained in three separate experiments for a total of nine replicates. Statistical significance was determined by unpaired t-test: (ns) P > 0.05, (*) P ≤ 0.05, (**) P ≤ 0.01, (***) P ≤ 0.001, (****) P ≤ 0.0001. (F) HART ratio in HCT116 degron cells analyzed by microscopy. HCT116 degron cells were transduced with HART construct for ODC1 or RAC1. After 48 h from the addition of either DMSO or auxin, the cells were fixed and imaged using an InCell Analyzer 6500HS. The HART ratio was calculated for each cell and averaged across replicate wells. Data were obtained in two separate experiments each for a total of 36 replicates. Statistical significance was determined by unpaired t-test: (ns) P > 0.05, (*) P ≤ 0.05, (**) P ≤ 0.01, (***) P ≤ 0.001, (****) P ≤ 0.0001.




