


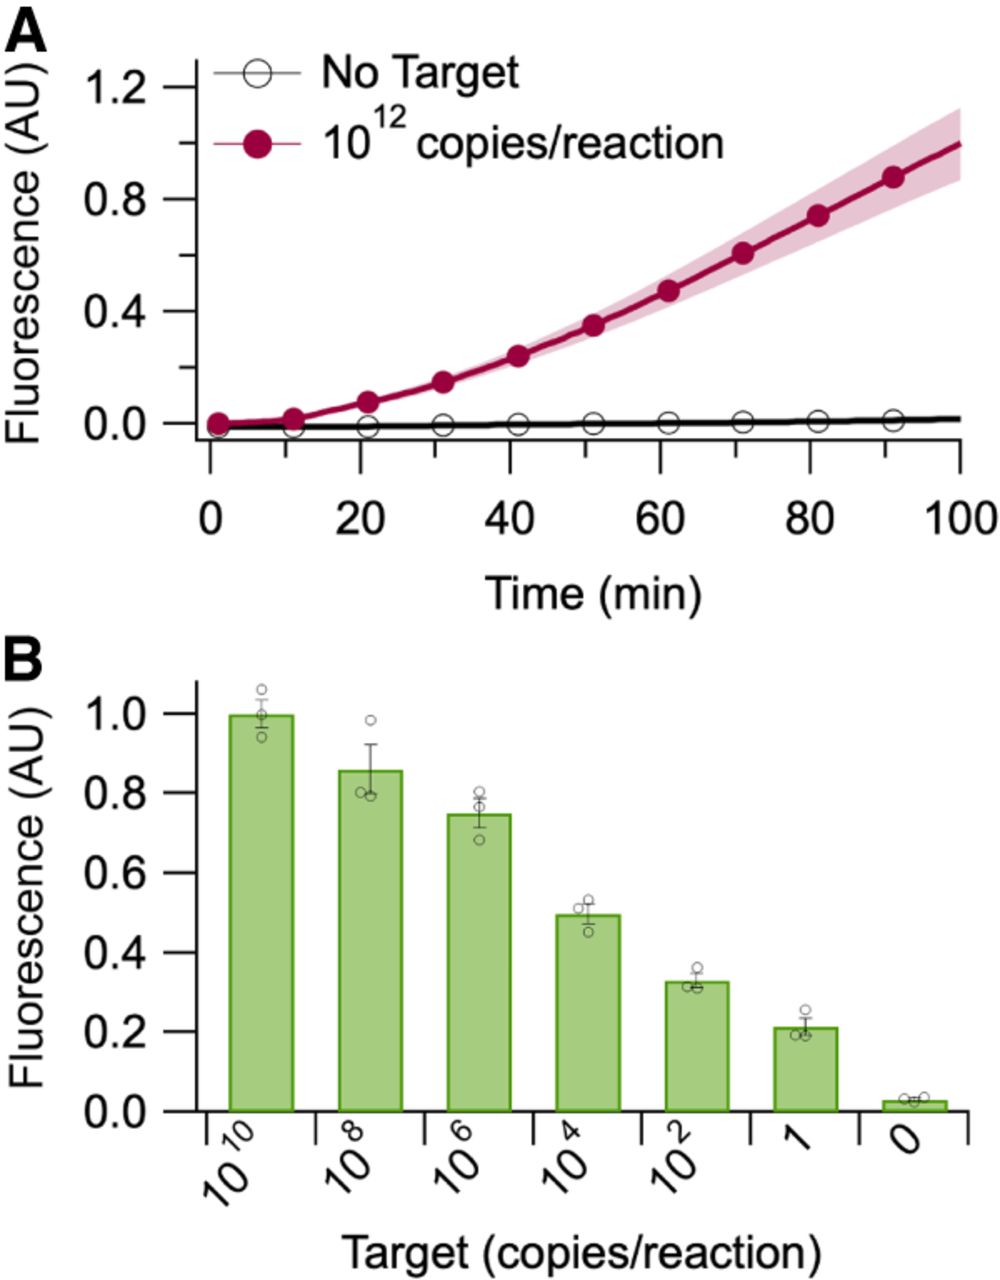
Time to detection and limit of detection of PACRAT with SARS-CoV-2 spike gene. (A) Testing the time to detection for PACRAT. Real-time fluorescence graph shows Pepper aptamer fluorescence curves for reactions with SARS-CoV-2 B.1.167 spike gene and reactions with no target. Time to detection (distinguishable difference between reactions with target and reactions without target) is 10 min for optimized reactions. Shaded area represents SEM, where n = 3. (B) Testing the sensitivity of PACRAT. Bar plot shows the normalized end point fluorescence values for PACRAT reactions with different target copies of SARS-CoV-2 B.1.167 spike gene. Individual data points for each triplicate are shown as black circles. Error bars represent SEM, where n = 3.




