


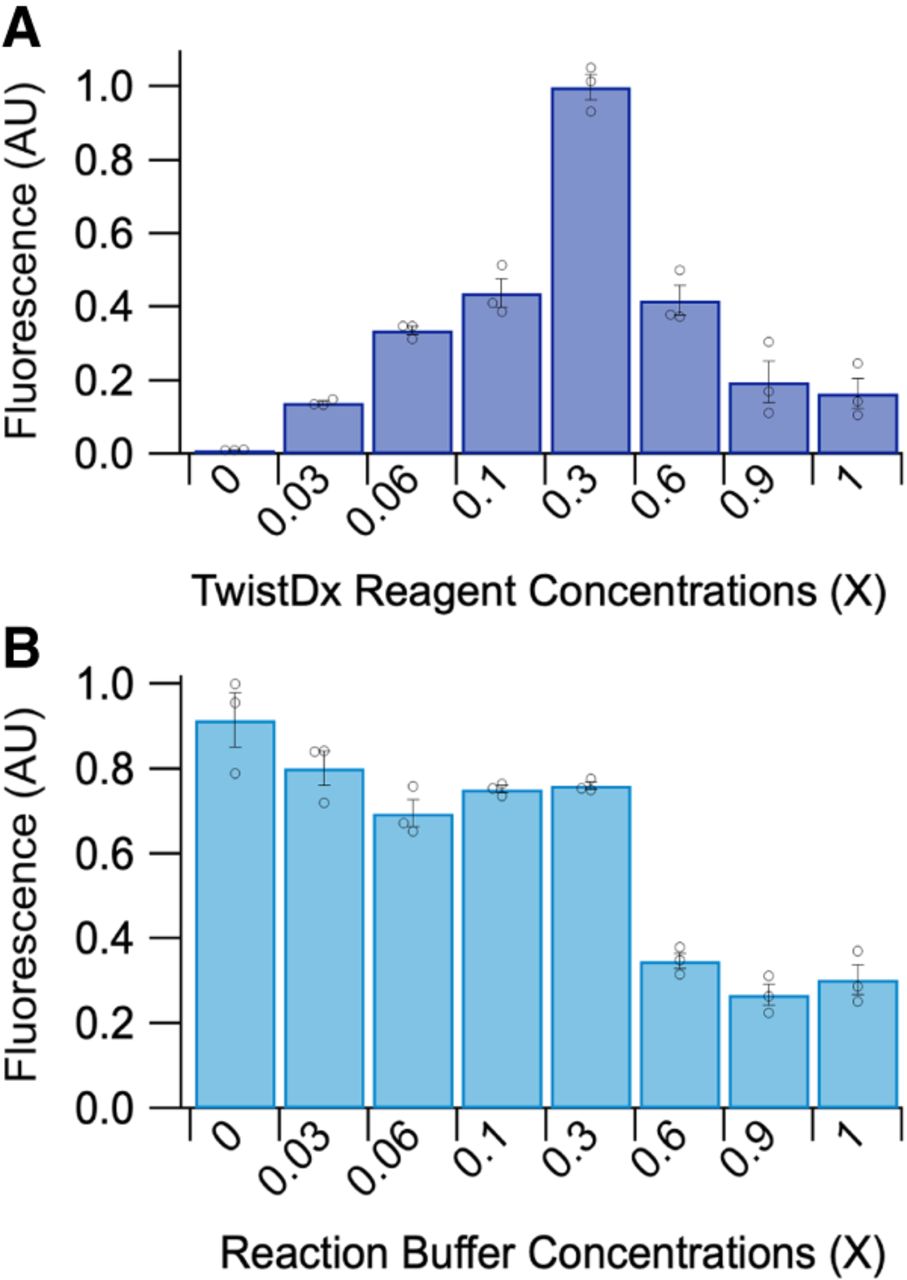
FIGURE 2.
Optimization of PACRAT reactions. (A) Bar plot showing the normalized end point fluorescence values for PACRAT reactions targeting the SARS-CoV-2 nucleocapsid N3 gene, with varying concentrations of reagents from the TwistDx RPA Kit. TwistDx reagents include the 2× Reaction Buffer, 20× Core Reaction Mix, and 10× Probe E-Mix. (B) Bar plot showing the normalized end point fluorescence values for PACRAT reactions with varying concentrations of the 2× Reaction Buffer from the TwistDx RPA Kit. Error bars represent SEM, where n = 3. Individual data points for each triplicate are shown as black circles.




