


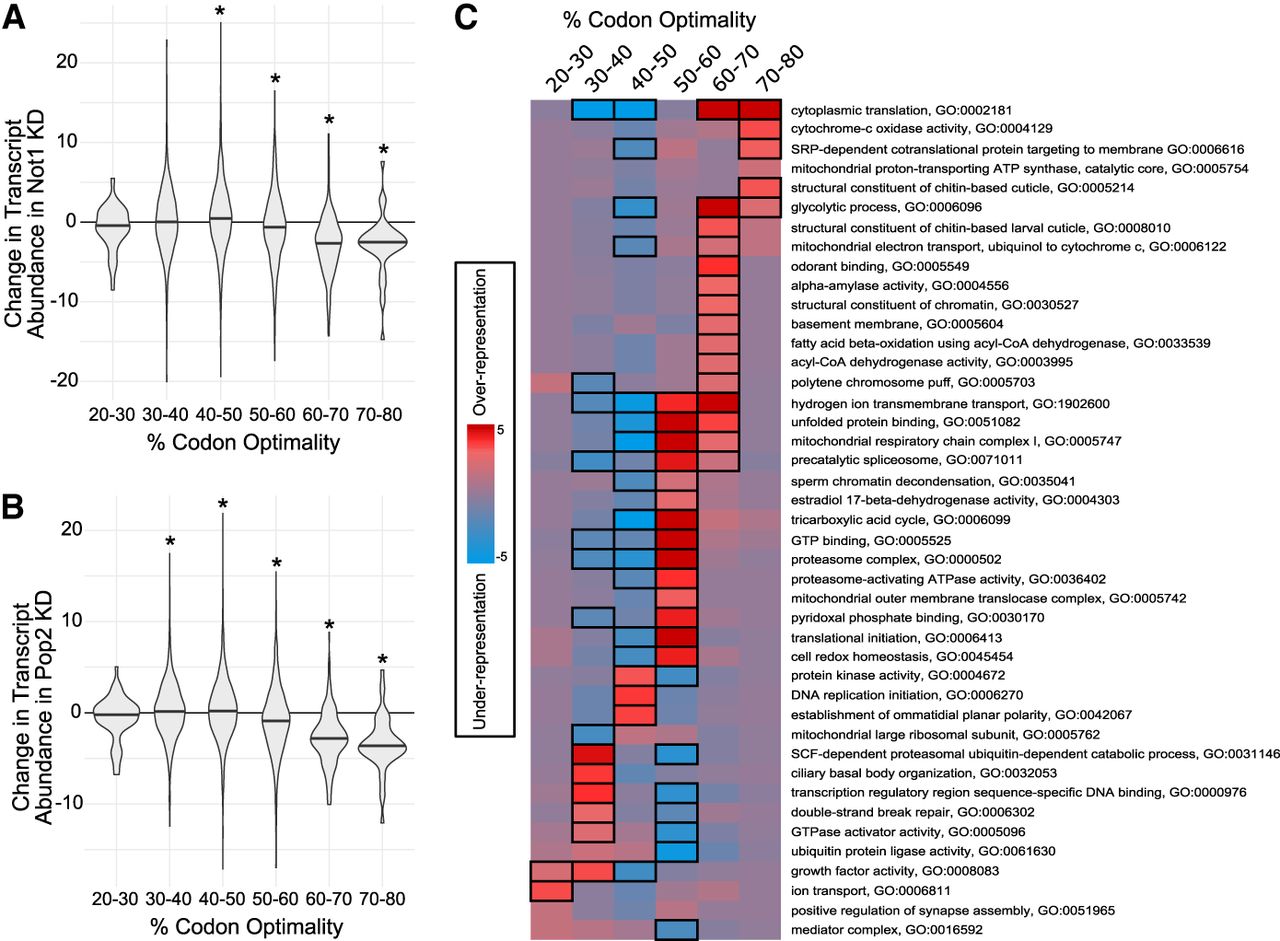
Low codon optimality does not confer the responsiveness of mRNAs to CCR4–NOT. (A) Density distributions of normalized log fold changes in mRNA abundance (Wald statistic) caused by Not1 KD for transcripts binned by their content of optimal codons. Density medians are indicated with black lines within each violin. Statistical significance of the changes, measured relative to negative control NTC RNAi condition (P-value ≤ 0.05, Wilcoxon rank-sum test) is indicated by an asterisk above each relevant violin. (B) As in A, for Pop2 knockdown data. (C) GO terms showing significant mutual information with genes sorted by the content of optimal codons, calculated using iPAGE, are listed on the right. The color of each cell shows the magnitude of the P-value for the significance of the enrichment (red) or depletion (blue) at that cell, scale is shown on the left-hand side of the figure; black bordered cells individually show P-value ≤ 0.05 after Bonferroni correction across their row.




