


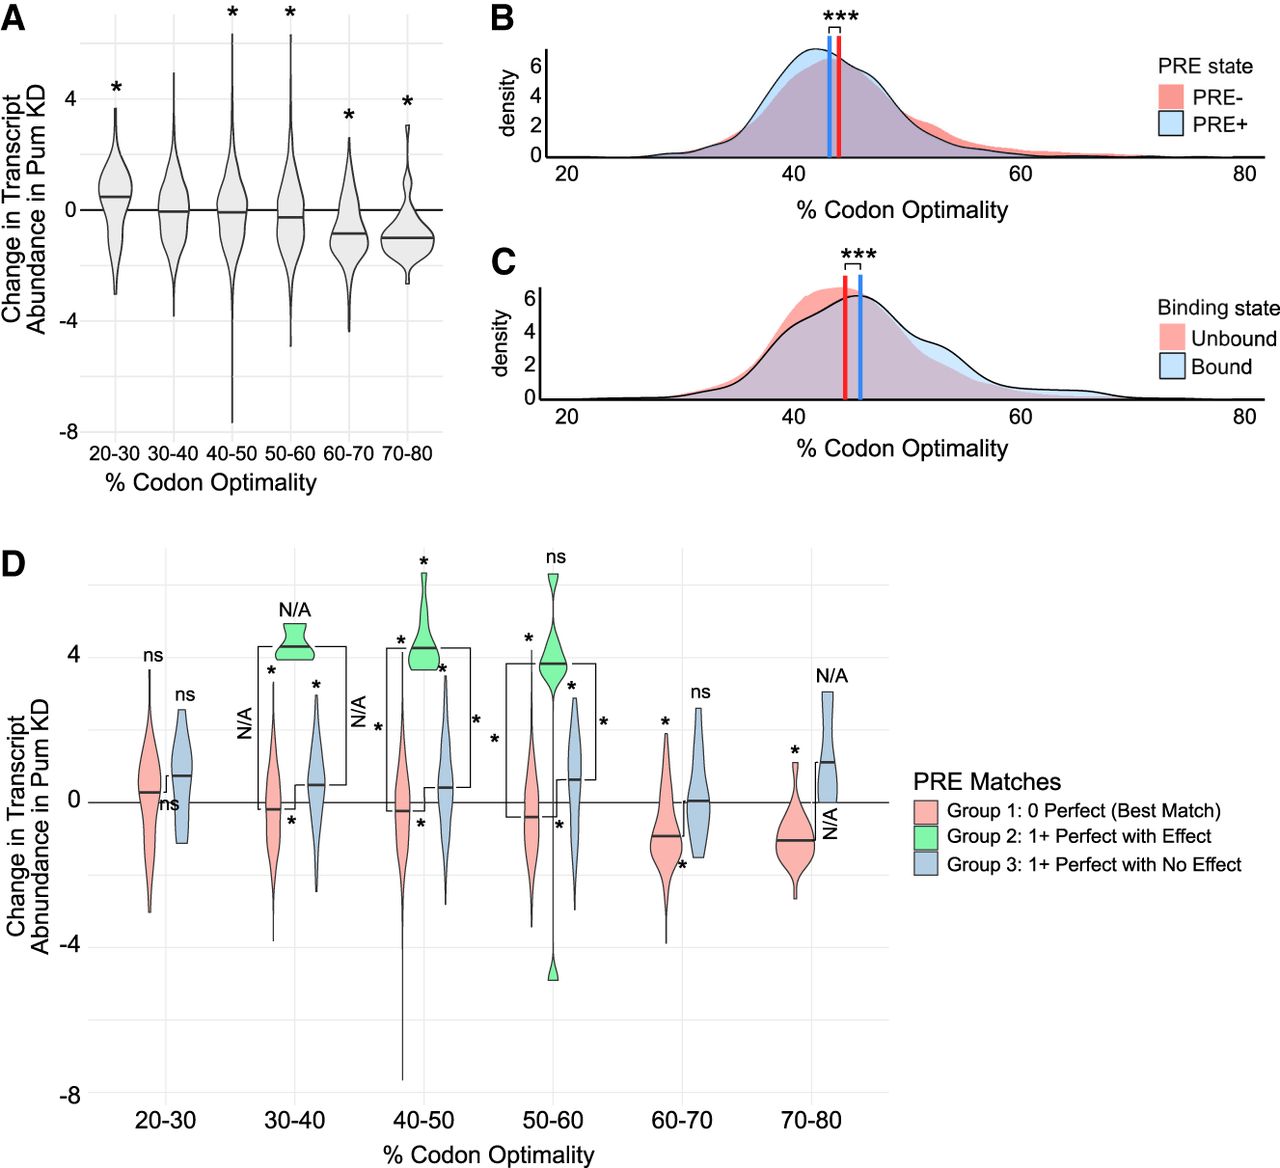
Codon optimality does not significantly correlate with direct mRNA repression by Pum. (A) Density distributions as violin plots of normalized log fold changes in mRNA abundance (Wald statistic) in Pum KD for transcripts binned by codon optimality. Density medians are indicated with black lines within each violin. Statistical significance (P-value ≤ 0.05, Wilcoxon rank-sum test) is indicated by an asterisk above each relevant violin. (B) Overlapping density distributions of the codon optimality for transcripts with (PRE+, in blue) or without (PRE−, in red) perfect PREs in the 3′ UTR. Distribution medians are indicated by vertical lines: 44.9% for PRE− and 44.1% for PRE+. A statistically significant difference between the distribution median and zero is denoted by an asterisk. (***) P < 0.001, Wilcoxon signed-rank test. (C) As in B, but for mRNAs classified as unbound (red) or bound (blue) by Pum RIP-seq, based on a log2 fold enrichment ≥1.5 and a q-value ≤ 0.05. Distribution medians are indicated by vertical lines: 44.5% for unbound and 45.8% for Pum-bound. Statistical significance is denoted by an asterisk. (***) P < 0.001, Wilcoxon rank-sum test. (D) Density distributions as violin plots of normalized log fold changes in transcript abundance (Wald statistic) in Pum KD for transcripts binned by codon optimality and divided into three groups, as defined in Table 5. Density medians are indicated with black lines within each violin. A statistically significant difference between the distribution median and zero is denoted by an asterisk above the respective violin (P-value < 0.05, Wilcoxon signed-rank test). Within each % codon optimality bin, statistically significant differences between distribution medians are denoted with asterisks alongside the black lines indicating which medians were compared (P-value < 0.05, Wilcoxon rank-sum test). Here, we use “ns,” to indicate median-to-zero or median-to-median comparisons that were not statistically significant. Not assessed “N/A” indicates median-to-zero or median-to-median comparisons that lacked a large enough sample size to test robustly (n ≤ 3). The placement of “ns” and “N/A” labels follows the same convention as for asterisks.




