


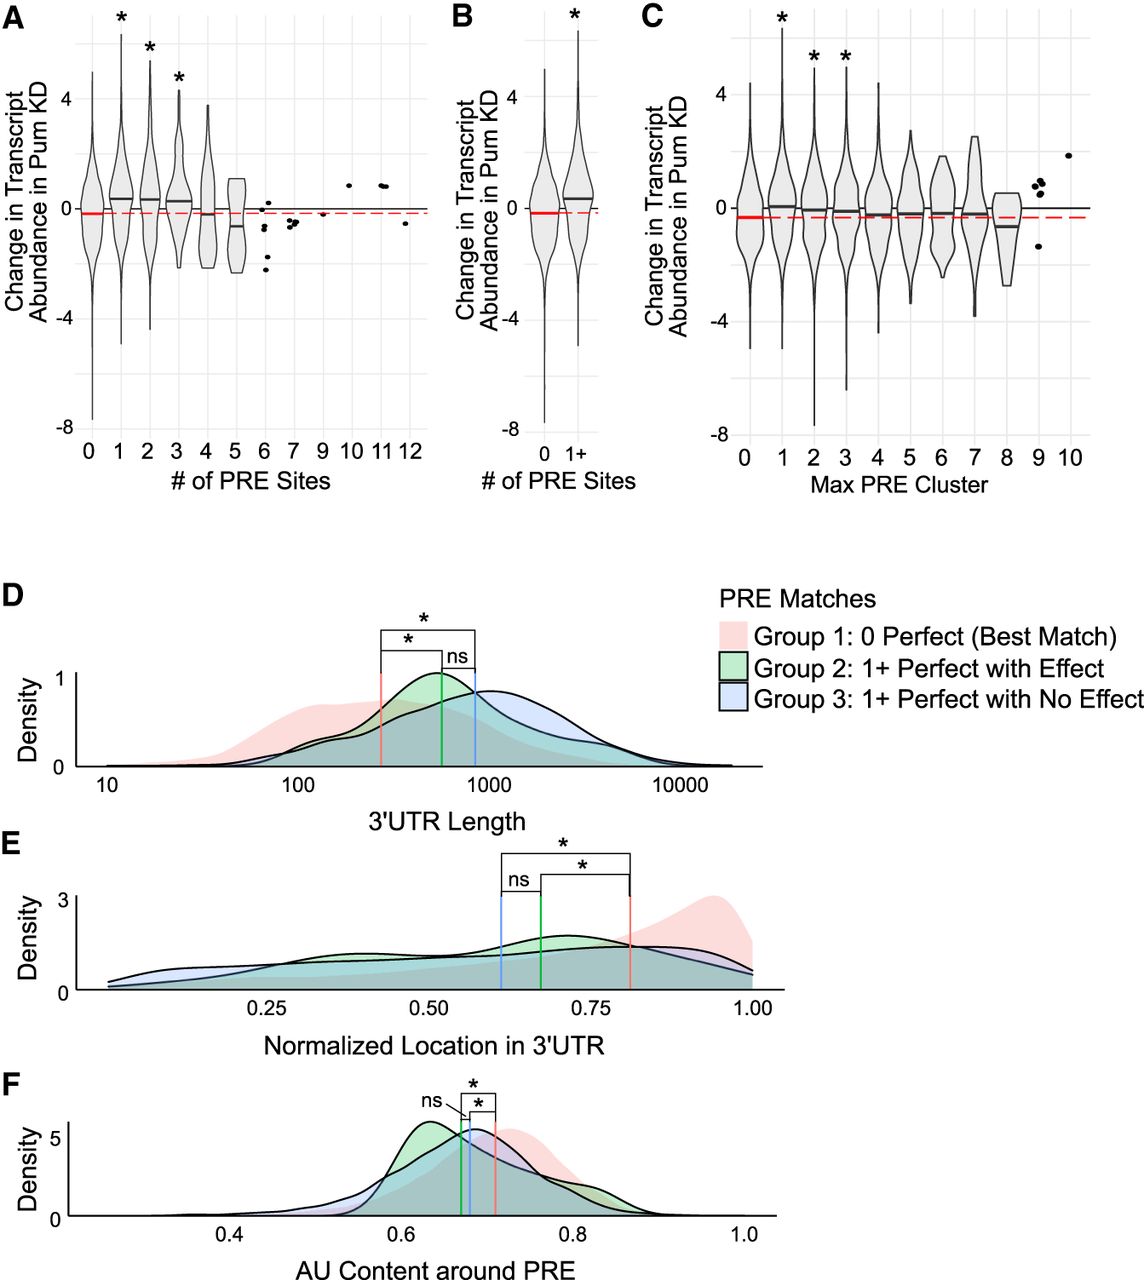
Functional associations between PRE features and differential gene expression in response to knockdown of Pum. (A–C) Density distributions of log fold changes (Wald statistic) in transcript abundance in Pum KD for transcripts (A) with different numbers of 3′-UTR PREs sites, (B) with or without a PRE site in the 3′ UTR, and (C) with different maximum numbers of 3′-UTR PRE sites clustered within a 100-nt window. Density medians are indicated with black lines within each violin. The null median is shown as a dashed red line across the width of each panel. Statistical significance (P-value ≤ 0.05, Wilcoxon rank-sum test) is indicated by an asterisk above each violin. The number of transcripts in each violin plot is reported in Supplemental Table S4. (D–F) Overlapping density distributions of (D) 3′-UTR length, (E) the normalized location of a 3′-UTR PRE, and (F) the %AU content within a 100-nt window of 3′-UTR PREs, for genes that had no perfect PREs (red), genes that had at least one PRE and passed the significance thresholds (LFC ± log2(1.3) and q-value ≤ 0.05) (green), and genes that had at least one PRE but did not pass the significance thresholds (blue). Density medians are indicated by their corresponding color-coded vertical line. Statistical significance (P-value ≤ 0.05, Wilcoxon rank-sum test) is indicated by an asterisk (ns = “not statistically significant”, i.e., P-value > 0.05).




