


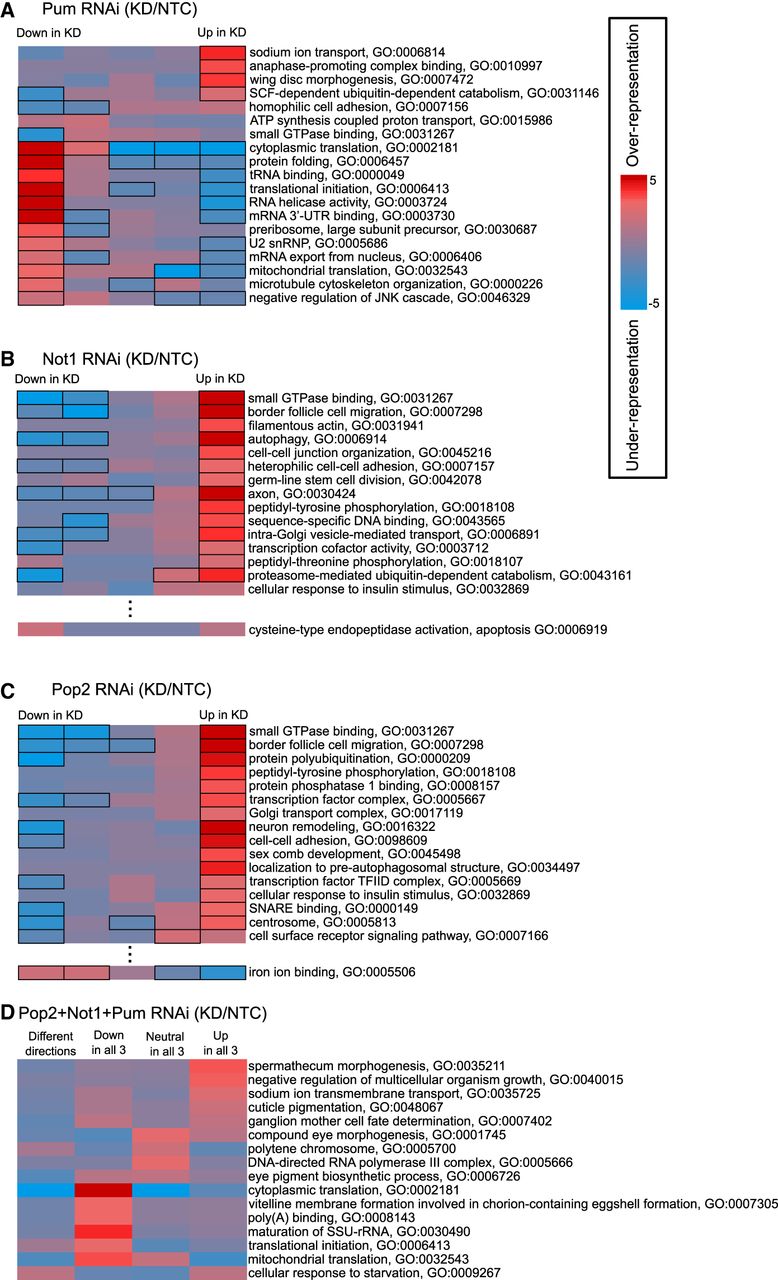
Gene ontology enrichment analysis of differentially expressed transcripts in response to Pum and CCR4–NOT knockdown relative to negative control RNAi (NTC). (A) GO terms showing significant mutual information with the observed LFCs upon Pum knockdown, measured in our RNA-seq data set. The genes were sorted into five equally populated bins, in order of their Wald statistic (scaled log fold change), ranging from strongly down-regulated on the left (Down in KD) to strongly up-regulated on the right (Up in KD). GO terms showing significant mutual information with the profiles of transcript abundance changes, calculated using iPAGE, are listed on the right. The color of each cell shows the magnitude of the P-value for the significance of the enrichment (red) or depletion (blue) at that cell. Scale is shown on the right-hand side of the figure; black bordered cells individually show P-values ≤ 0.05 after Bonferroni correction across their row. The plotting and highlighting conventions described here apply to all panels of the figure except for D, which is a discrete analysis and lacks the indication of Bonferroni corrected P-values ≤ 0.05. (B) As in A, for Not1 knockdown data. The dashed line indicates the omission of GO terms which are not strongly enriched in the “Up in KD” bin; see Supplemental Figure S6 for the complete output. (C) As in A, for Pop2 knockdown data; untruncated output is shown in Supplemental Figure S7. (D) GO term enrichment analysis using iPAGE of four categories of genes based on their down-regulation (Down in all 3) or up-regulation (Up in all 3) upon knockdown of Pum, Not1, and Pop2. The “neutral” category encompasses genes that were not differentially expressed in any knockdown. The “Different directions” category includes the genes that responded in opposition between any two knockdown conditions.




