NMR characterization and ligand binding site of the stem–loop 2 motif from the Delta variant of SARS-CoV-2

(Downloading may take up to 30 seconds. If the slide opens in your browser, select File -> Save As to save it.)

Click on image to view larger version.

FIGURE 3.
FIGURE 3.

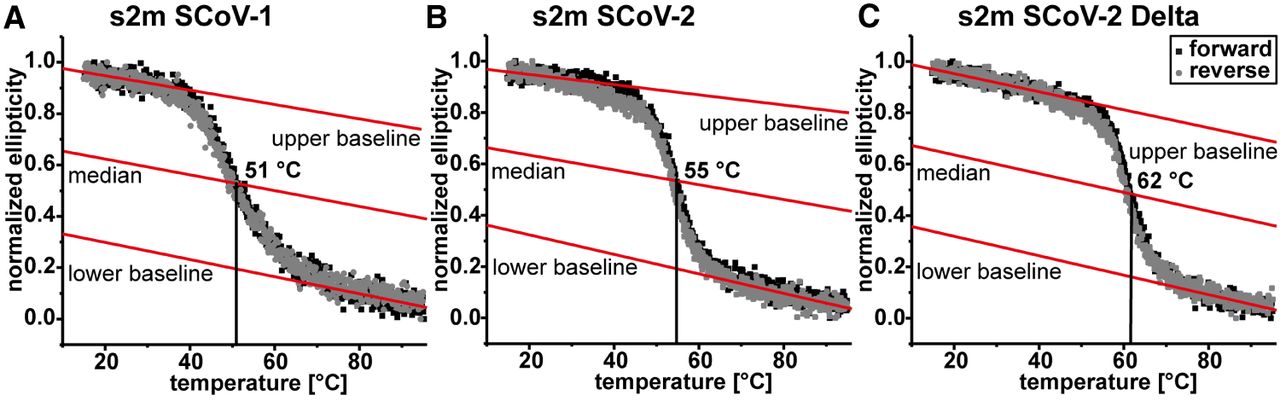
CD melting curves of s2m SCoV-1 (A), SCoV-2 (B), and Delta (C). All melting points are annotated. Black and gray curves correspond to measurements with increasing (forward) or decreasing (reverse) temperatures, respectively. Baselines and medians are shown as red lines.

This Article

  1. RNA 30: 779-794

