


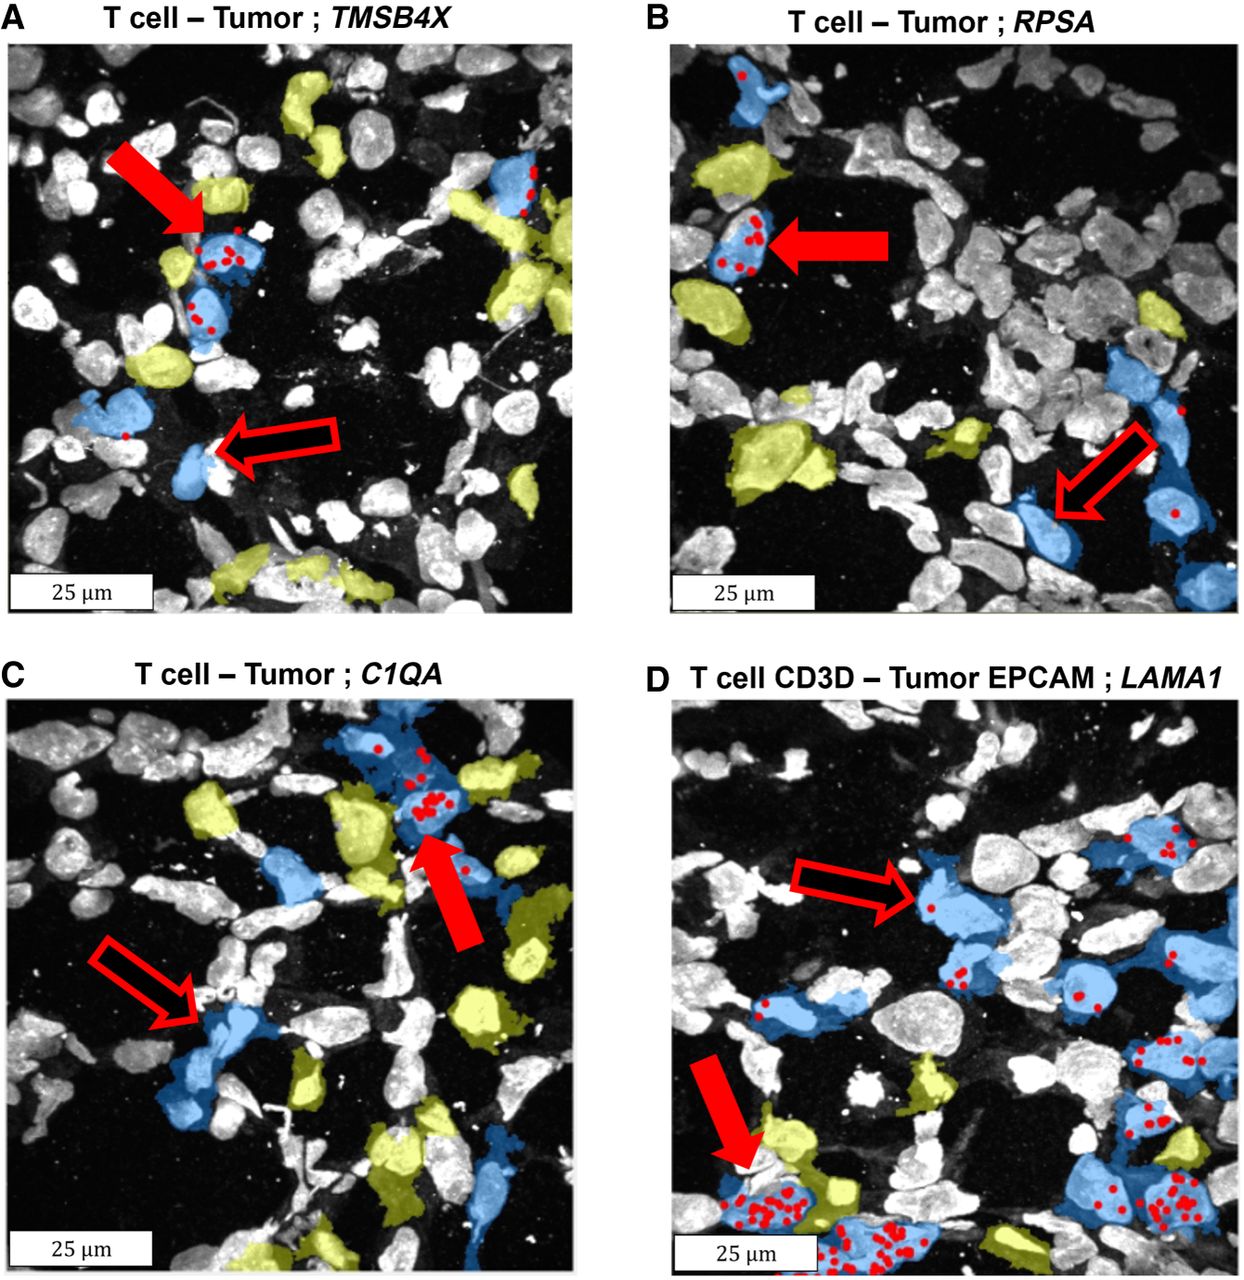
Example of genes identified as induced in T cells when proximal to tumor cells. Sequencing reads locations (red spots) of four induced genes are overlaid on the DAPI staining of the nuclei, as well as the segmentation of T cells (blue) and tumor cell types (yellow). The cell bodies were detected using InSituSeg, and the cell types were identified using clustering of the gene expression profiles. Only segmentations of T cells and tumor cells are presented. Genes up-regulated in T cells due to proximity to tumor cells have more red spots when proximal to tumor cells (exemplars in full red arrows vs. hollow red arrows). (A) The gene TMSB4X was detected by differential expression (DE), by matrix factorization (MF), and by machine learning (ML), when examining all T cells and all tumor cells. (B) The gene ribosomal protein SA (RPSA) was detected by DE, by ML, and by MF, when examining all T cells and all tumor cells. (C) The gene Complement Component 1, Q Subcomponent, A Chain (C1QA) was detected by DE when examining all T cells and all tumor cells. (D) The gene laminin subunit α 1 (LAMA1) was detected by DE and by ML, when examining the subtype T cell-CD3D and the subtype tumor-EPCAM. Each panel shows a subset region from the biopsy, acquired with a 40× objective, 100 × 100 µm in size (before expansion). Note that max projection is shown and therefore some cells seem to overlap, but they are clearly separated in 3D (Supplemental Fig. S1). DE was performed with DeSeq2 (Love et al. 2014), ML with CatBoost (Dorogush et al. 2018), and MF with cNMF (Kotliar et al. 2019). Permutation analysis was performed on all methods to assess statistical significance.




