


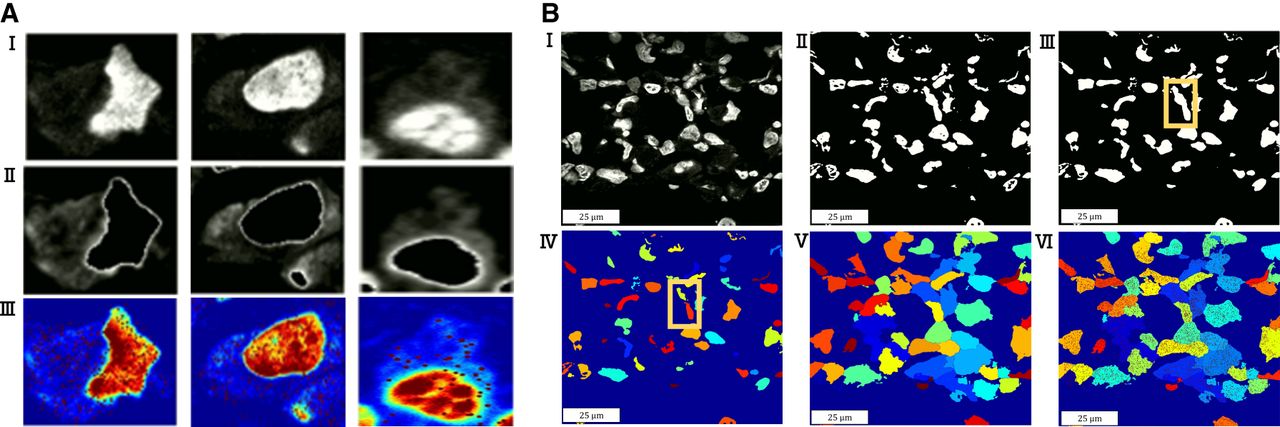
Scheme of the InSituSeg pipeline. The pipeline uses dense mapping of genes in situ for segmentation of cell bodies, using pixel intensity thresholding of 3D images. The input is a DAPI-stained image and the spatial locations of the mRNA molecules, and the output is a segmented 3D image with the mRNA assigned to each cell body. (A) Three cells are presented (columns). (I) After DAPI staining, the signal of the cell bodies is weaker compared to the strong nucleus staining of genomic DNA, but nevertheless can be clearly detected in the examined cells with pixel intensity thresholding (II). (III) A clear overlap between the hues observed in the DAPI image and the sequenced RNA (red dots, the DAPI intensities are shown in red–blue for better visualization). This overlap further confirms that the hues correspond to cell bodies. (B) The segmentation pipeline is composed of six steps (Materials and Methods): (I) Illumination correction. (II) Detection of nuclei voxels. (III) Refinement of nuclei voxels. (IV) Splitting of large nuclei. For example, the large putative nucleus marked by a yellow rectangle in III is split in IV into two nuclei. (V) Detection of cell body voxels using watershed segmentation. (VI) Assignment of mRNA molecules to cell bodies.




