


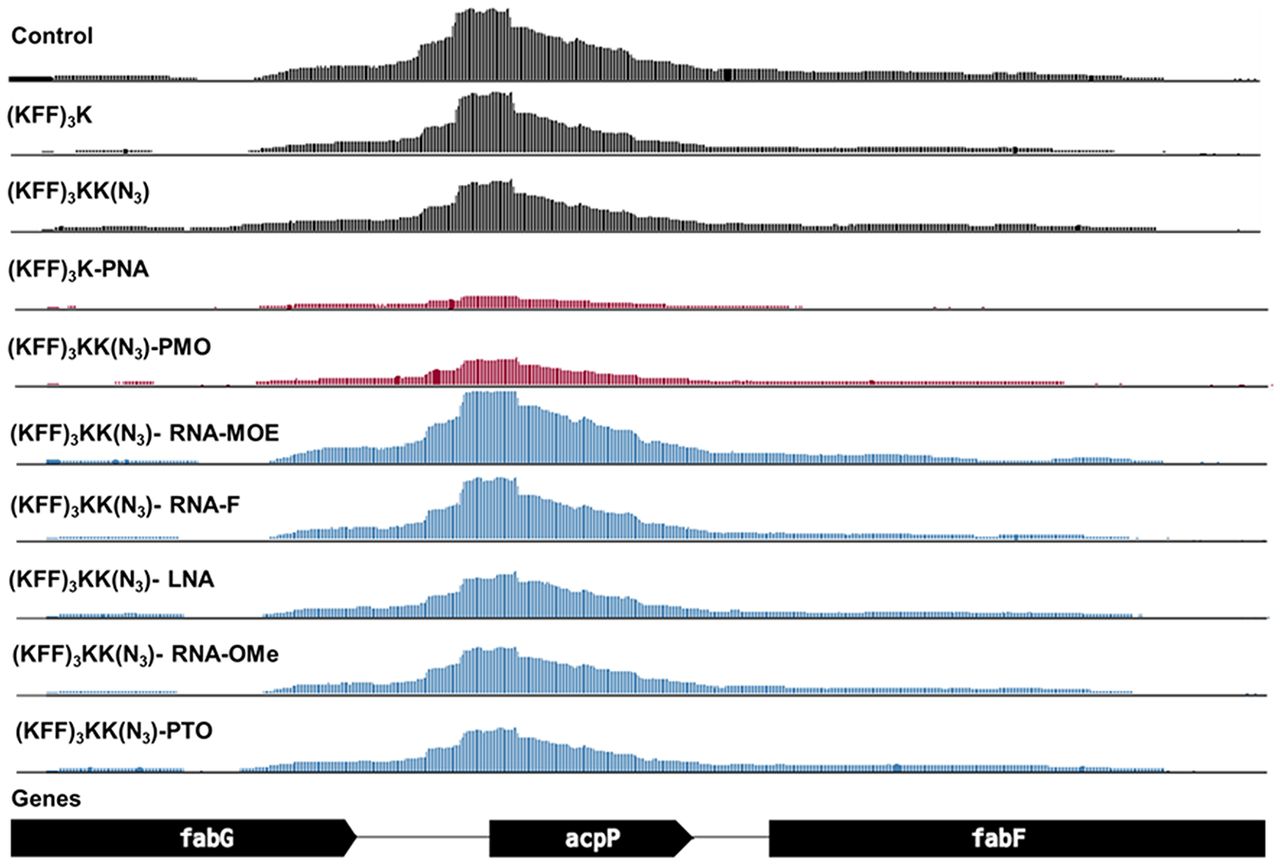
FIGURE 8.
Coverage plot of the acpP transcript and neighboring genes for all tested RNA-seq conditions. The coverage plot shows the abundance of mapped reads normalized by counts per million (CPM). The y-axis of all tracks shows the normalized read depth per position, ranging from 0 to 1500 CPM. Control samples without ASO, ASO modalities triggering significant (log2FC < −1 and FDR < 0.001) acpP depletion and other ASO modalities are colored in black, red, and blue, respectively. One replicate (R1) of the RNA-seq data is shown.




