


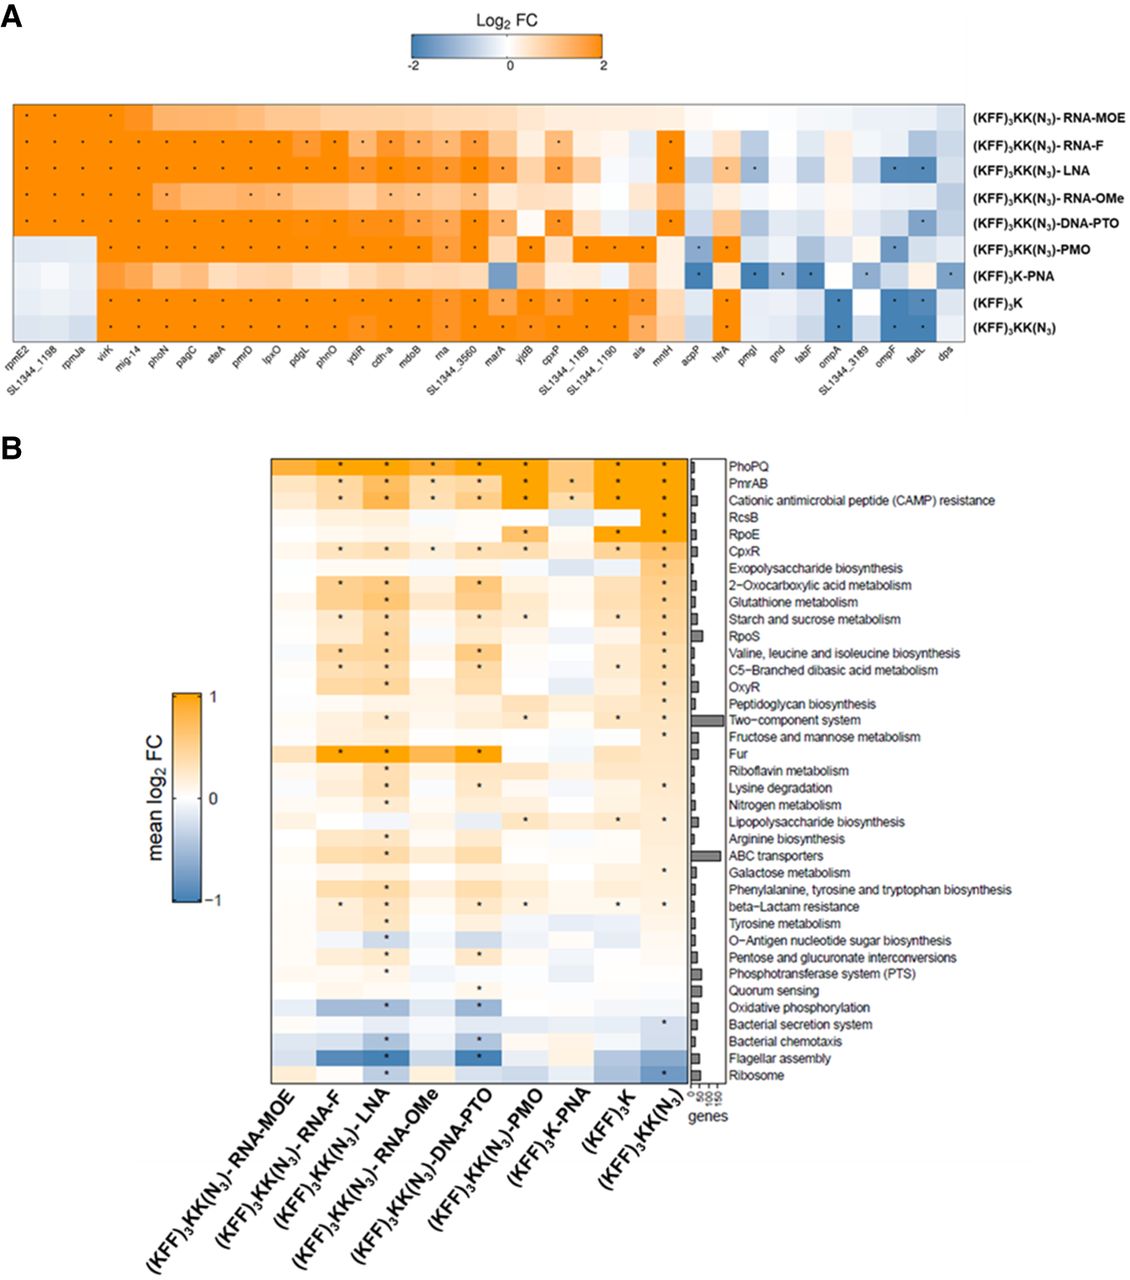
Analysis of differentially expressed genes, KEGG pathways, and regulons. (A) Heatmap showing the most strongly differentially expressed genes for all KFF-ASO conjugates. Duplicate RNA-seq samples of Salmonella treated for 15 min with KFF-ASOs were normalized to untreated control samples. Log2FCs are indicated by color. Orange and blue colors indicate up- and down-regulation, respectively. The heatmap includes the top 10 regulated transcripts per condition. Asterisks (*) denote significantly regulated (absolute log2FC > 1 and FDR-adjusted P-value < 0.001) genes in the respective condition. (B) The heatmap shows the mean log2FC for genes assigned to the gene sets. Only the 10 most significantly enriched/depleted gene sets per condition are visualized. Asterisks (*) denote statistical significance (FDR-adjusted P-value < 0.01) in the respective condition. The bar chart on the right shows the number of genes assigned to the respective gene set.




