


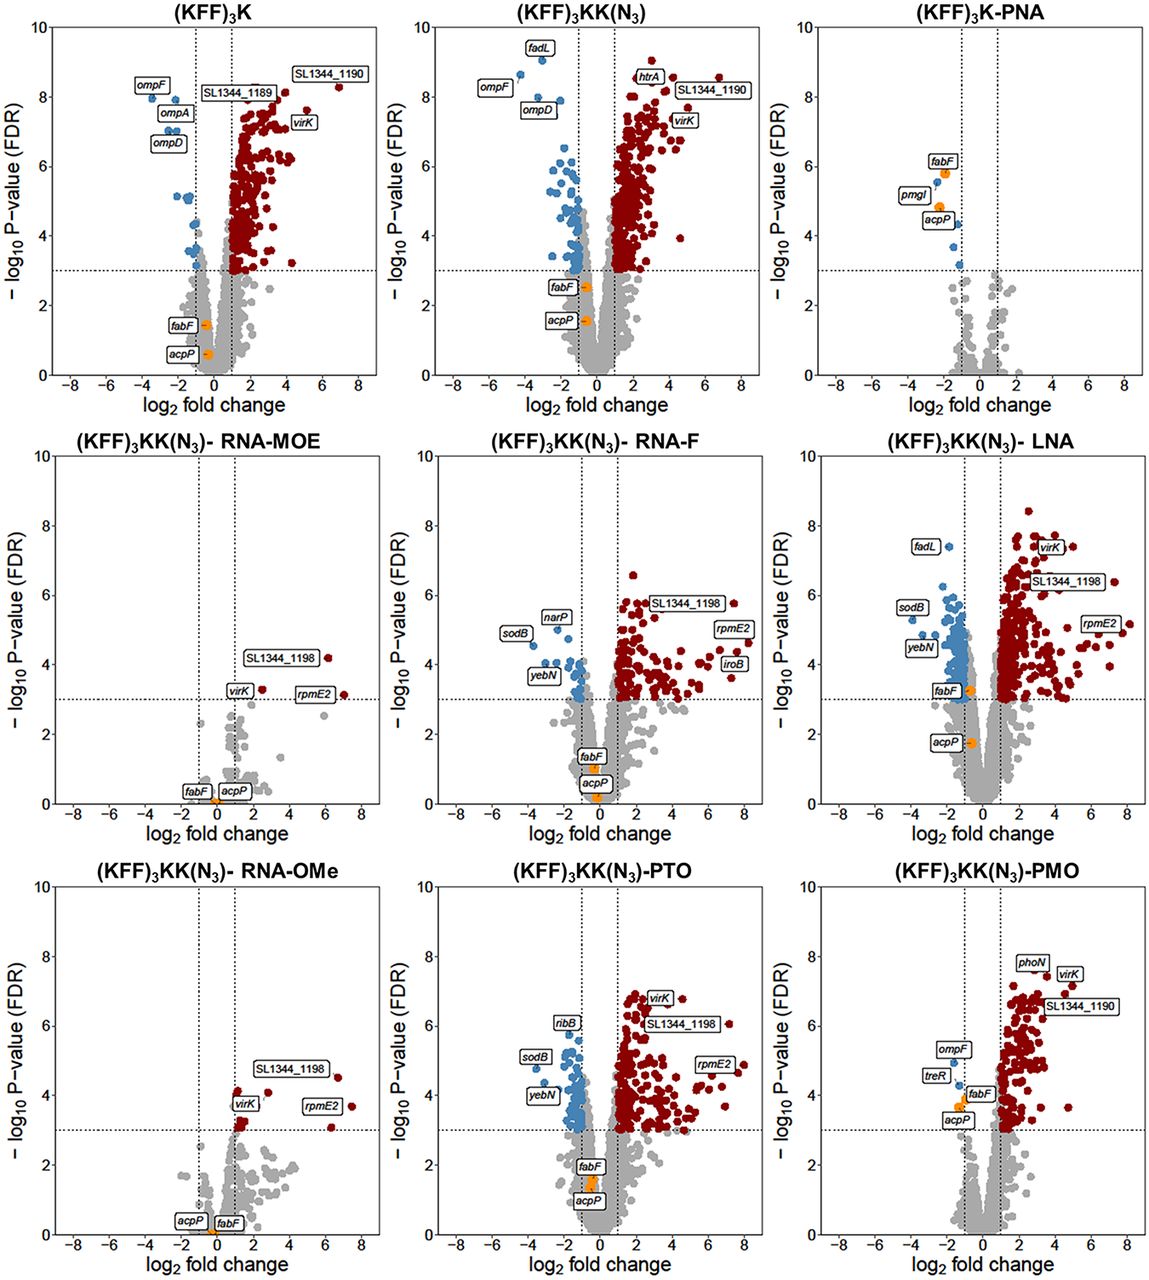
FIGURE 6.
Transcriptomic responses of Salmonella upon KFF-ASO treatment. Volcano plots show calculated changes in Salmonella gene expression as FDR-adjusted P-value (−log10, y-axis) and fold change (FC) (log2, x-axis). Significantly differentially regulated genes are characterized by an absolute FC > 2 (down-regulated log2 < −1, up-regulated log2 > 1; vertical dashed line) and an FDR-adjusted P-value < 0.001 (−log10 > 3, horizontal dashed line). Significantly down-regulated genes are highlighted in blue, up-regulated genes are highlighted in red. The top three up- or down-regulated transcripts are labeled.




