


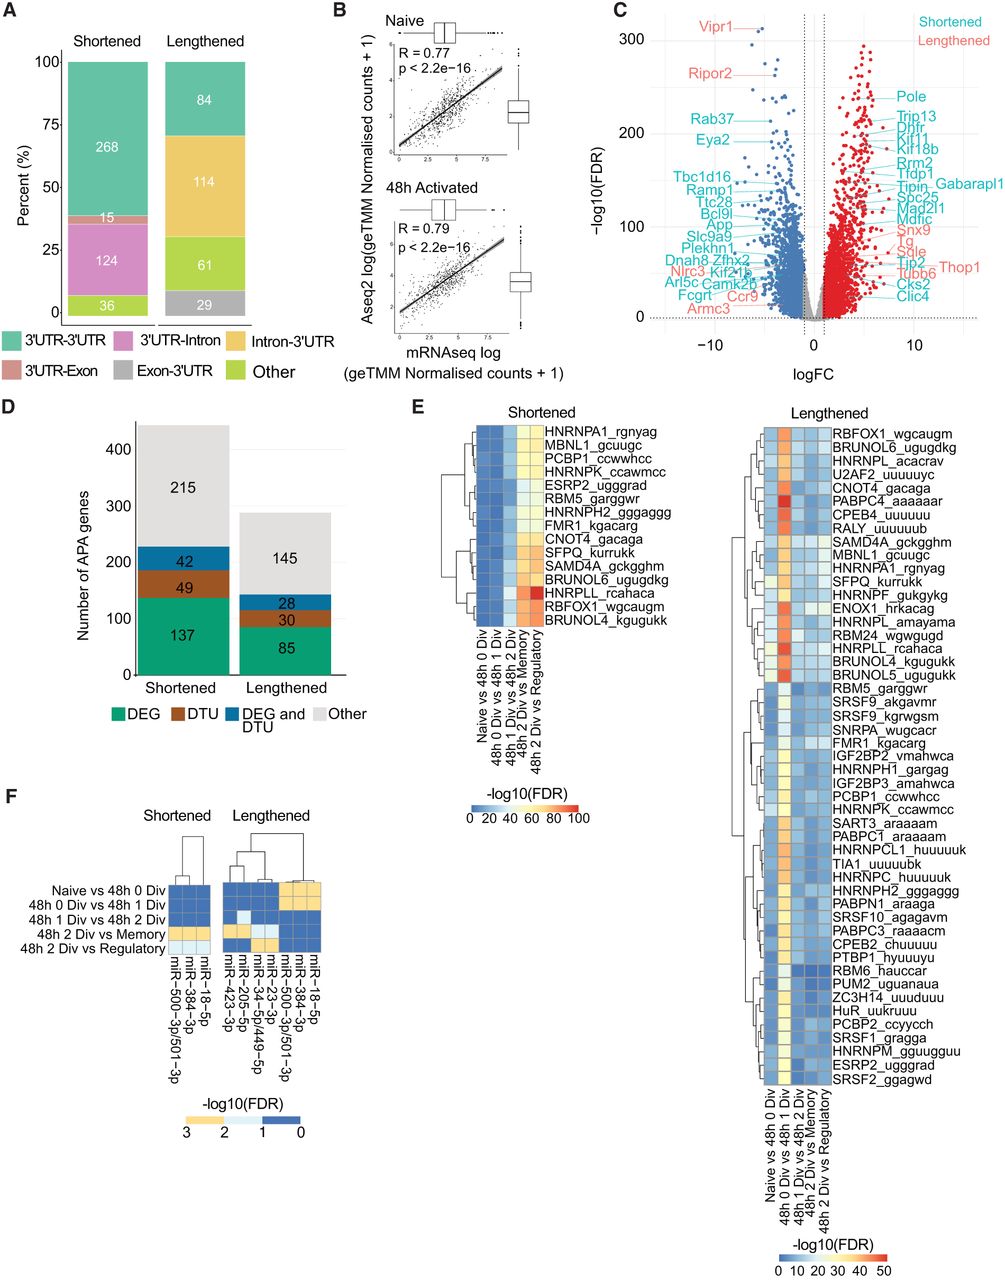
APA events and transcript abundance regulation. (A) Classification of APA events per type of transition. (B) Pearson correlation of mRNA-seq (Dölz et al. 2022) and A-seq2 gene coverage at naive (left) and 48 h after activation (right). Reported values are log-transformed normalized counts + 1. Boxplots indicate value distribution and their mean. (C) Volcano plot resulting from mRNA differential analysis (Dölz et al. 2022). Blue and red dots indicate genes with FDR < 0.01 and absolute logFC > 1. APA genes that are also DEG are indicated: light blue indicates shortening event and red, lengthening event. (D) Barplot reporting number of APA genes is also differentially expressed (DEG), having a DTU of both or none. (E,F) Heatmaps show enrichment for miRNA (E) and RBP (F) binding sites within alternative 3′ UTR by type of event, shortening or lengthening. Color legend indicates −log10 (FDR).




