


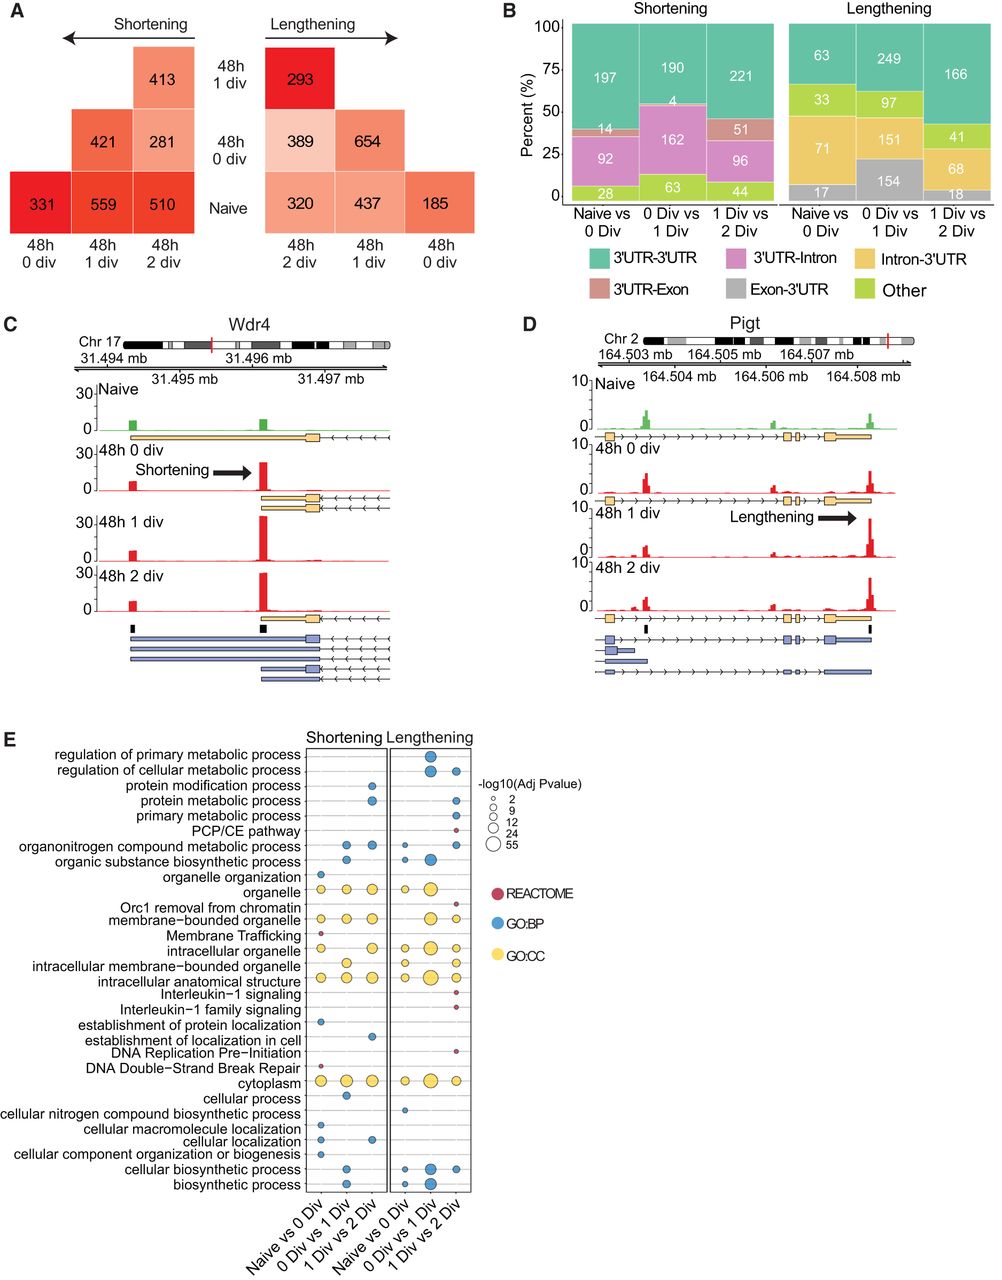
Identification of alternative poly(A) site usage. (A) Number of shortening and lengthening events identified in each comparison. Dark color indicates higher numbers, light color indicates lower numbers. (B) Classification of APA events per type of transition. (C,D) Example of Wdr4 gene (chr17:31,493,503–31,497,899, “−”), whose shortened transcripts are more abundant upon activation, and Pigt gene (chr2:164,502,304–164,508,853, “+”), whose longer transcripts are more abundant upon activation. Arrow indicates the event direction. Yellow boxes represent isoforms identified using PacBio long-read sequencing, blue boxes represent Gencode (v25) isoforms, and black boxes indicate PAS. (E) Functional annotations of genes associated with an APA event. Dot colors indicate source types. Dot size represents −log10(adjusted P-values).




