


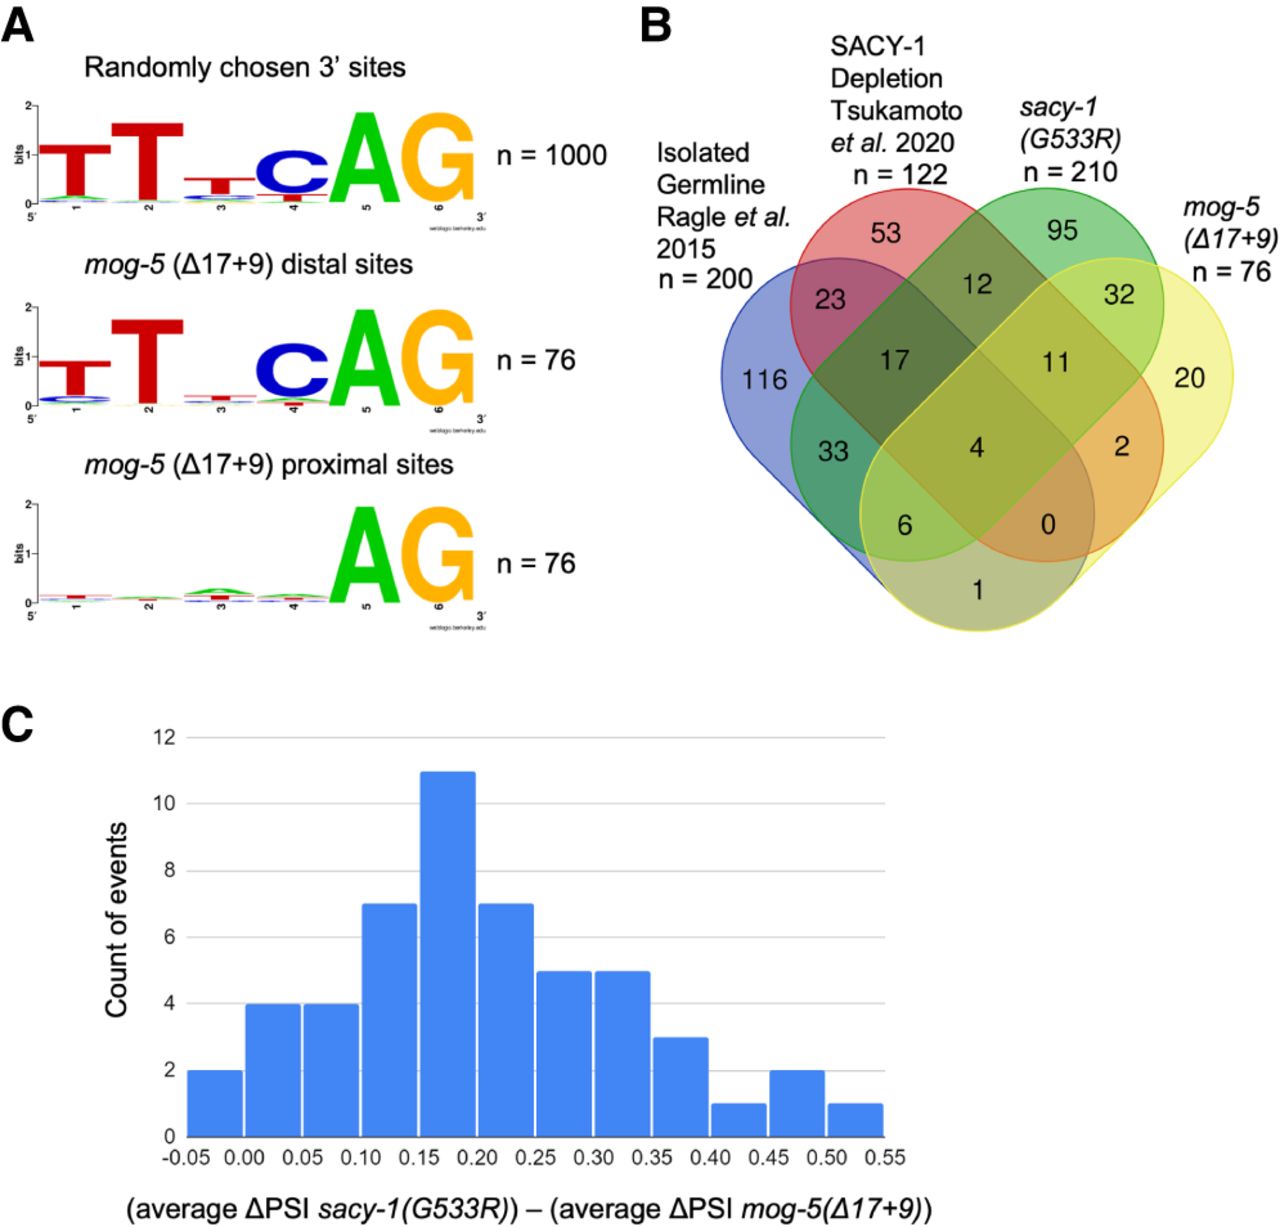
Global analysis of splicing phenotypic overlap between sacy-1(G533R) and mog-5(Δ17 + 9). (A) Sequence logo. The height of each base represents significant enrichment of nucleotide identity at that position over random chance, created on WebLogo (https://weblogo.berkeley.edu/) (Crooks et al. 2004). (B) Venn diagram. Numbers correspond to the number of overlapping A3 events between RNA-seq experiments. Image created on WebTools (https://bioinformatics.psb.ugent.be/webtools/Venn/). (C) Histogram. Difference in the strength of splicing change by sacy-1(G533R) and mog-5(Δ17 + 9). For every A3 event that was alt. spliced in both analyses, the average ΔPSI of all the pairwise comparisons within that event for mog-5(Δ17 + 9) was subtracted from the corresponding number for sacy-1(G533R).




