


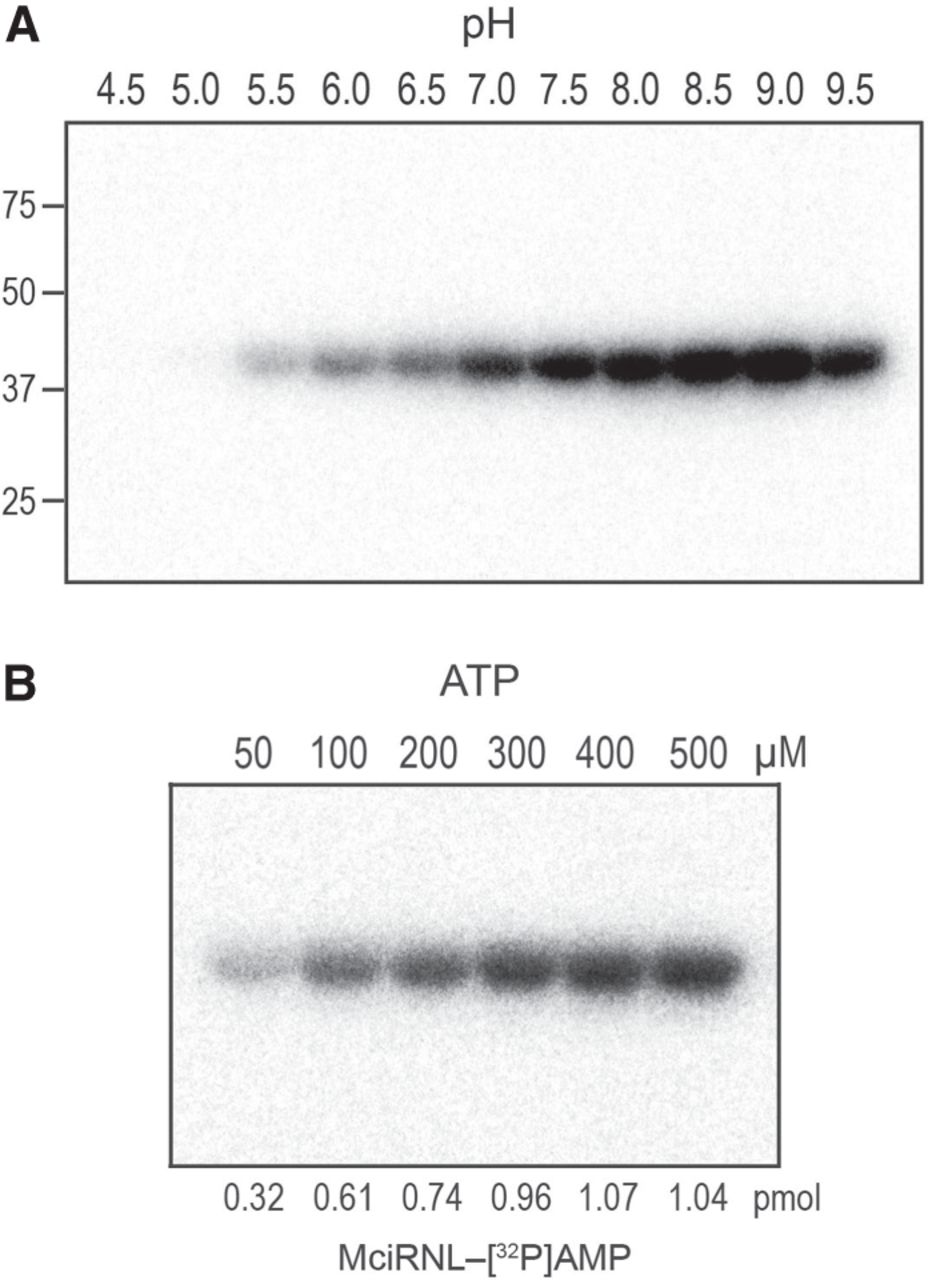
MciRNL adenylylation. (A) pH dependence. Reaction mixtures (10 µL) containing either 50 mM Tris-acetate (pH 4.5, 5.0, 5.5, 6.0, or 6.5) or 50 mM Tris-HCl (pH 7.0, 7.5, 8.0, 8.5, 9.0, or 9.5), 5 mM MgCl2, 50 µM [α32P]ATP, and 10 µM (100 pmol) MciRNL were incubated at 37°C for 5 min, then quenched with SDS, and analyzed by SDS-PAGE. A scan of the gel is shown. The positions and sizes (kDa) of marker proteins are indicated on the left. (B) ATP concentration-dependence. Reaction mixtures (10 µL) containing 50 mM Tris-HCl, pH 9.0, 5 mM MgCl2, 10 µM (100 pmol) MciRNL, and 50, 100, 200, 300, 400, or 500 µM [α32P]ATP were incubated at 37°C for 5 min, then quenched with SDS, and analyzed by SDS-PAGE. A scan of the gel is shown. The extents of MciRNL–[32P]AMP formation are indicated below the lanes.




