


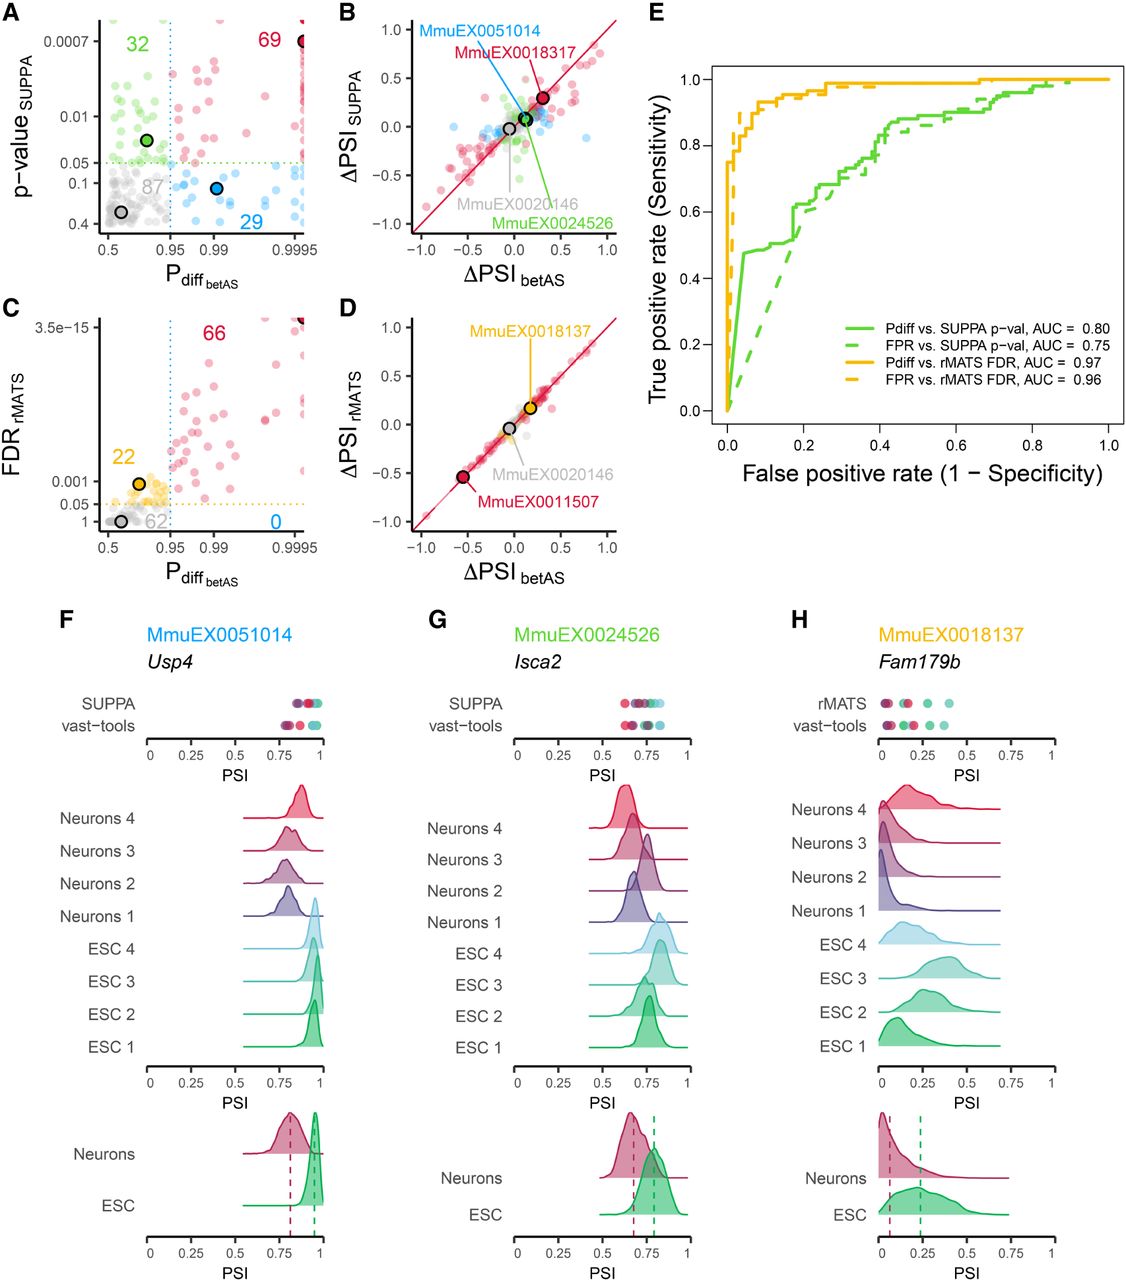
Comparison of the significance of differential AS between betAS, SUPPA, and rMATS. (A) Scatterplot comparing betAS’ and SUPPA's differential AS significance metrics. betAS’ estimated probability of differential AS, based on the proportion of differences between the beta distributed randomly emitted values per group that are >0 (Pdiff) and SUPPA's P-value, with dashed lines defining quadrants indicating the significance cutoffs considered (Pdiff > 0.95 for betAS, P-value <0.05 for SUPPA). Points are colored based on the differential AS calls by both tools: events considered differentially spliced by both betAS and SUPPA (red), by betAS (blue), or SUPPA (green) alone or by none of the tools (gray). Selected example events for each quadrant as larger outlined dots. (B) Scatterplot comparing betAS’ and SUPPA's differential AS effect size (ΔPSI). Red diagonal solid line indicates identity: ΔPSISUPPA = ΔPSIbetAS. (C) Scatterplot comparing betAS’ and rMATS' differential AS significance metrics. betAS’ Pdiff and rMATS' FDR, with dashed lines defining quadrants indicating the significance cutoffs considered (Pdiff > 0.95 for betAS, FDR < 0.05 for rMATS). Points are colored based on the differential AS calls by both tools: events considered differentially spliced by both betAS and rMATS (red), by betAS (blue), or rMATS (yellow) alone or by none of the tools (gray). Selected example events for each quadrant as larger outlined dots. (D) Scatterplot comparing betAS’ and rMATS' differential AS effect size (ΔPSI). Red diagonal solid line indicates identity: ΔPSIrMATS = ΔPSIbetAS. (E) Receiving operating characteristic (ROC) curves betAS’ differential AS calls with Pdiff (solid lines) and FPR (dashed lines), considering as ground truth the differential calls from SUPPA (yellow, P-value <0.05) or rMATS (green, FDR < 0.05). (F–H) SUPPA and vast-tools’ PSIs (top) and densities of emitted beta distributed values for individual samples (middle) and their merging per sample group (bottom, with dashed lines signing median values) for selected events illustrative of different combinations of effect size and significance of AS differences, identified by vast-tools’ IDs (VAST-DB annotation for the mouse mm10 genome assembly): (F) MmuEX0051014 (gene Usp4, chr9:108388277–108388380), (G) MmuEX0024526 (gene Isca2, chr12:84773793–84773908), (H) MmuEX0018137 (gene Fam179b, chr12:64990941–64991090). (ESCs) Embryonic stem cells.




