


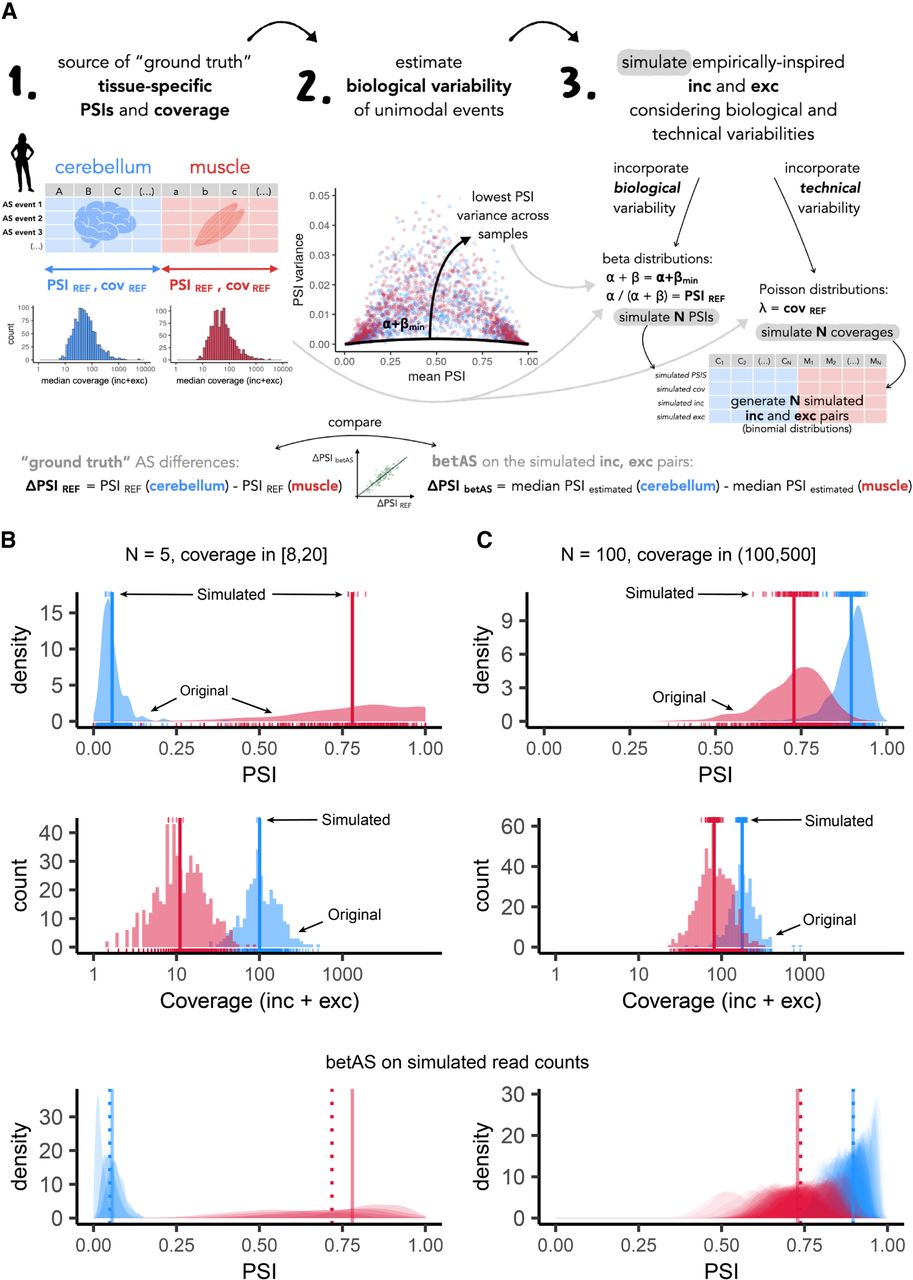
betAS accuracy in measuring PSI differences from simulated read counts. (A) Explanatory diagram of the implemented approach to simulate empirically inspired RNA-seq junction read counts. Reference PSI (PSIREF) and coverage (covREF) values for 563 muscle (red) and 309 cerebellum (blue) samples in GTEx version 7 are used to generate N (number of replicates) pairs of randomly emitted low-variance PSI and coverage values per event, used to simulate RNA-seq junction read counts on which betAS accuracy in measuring PSI differences can be evaluated. (B,C) Examples of the simulation approach applied over a low coverage, covREF in [8,20] junction read counts, and low number of replicates, N = 5, event (B) and over a high coverage, covREF in [100,500] junction read counts, high number of replicates, N = 100, event (C). (Top panels) Density and bottom rug plot showing the original distribution of PSI values for all samples; top rug plot showing the randomly emitted (simulated) low-variance PSIs. Vertical lines indicate PSIREF values for muscle and cerebellum. (Middle panels) Histogram and bottom rug plot showing the original distribution of coverage values for all samples; top rug plot showing the randomly emitted coverage values. Vertical lines indicate covREF values for muscle and cerebellum. (Bottom panels) “betAS on simulated read counts”: density plots representing PSI estimation as done in betAS, with values randomly emitted from a beta distribution with the shape associated with the simulated junction read counts per sample. Solid vertical lines indicate PSIREF values for muscle and cerebellum, while dashed vertical lines indicate the median PSI values estimated by betAS for muscle and cerebellum.




