


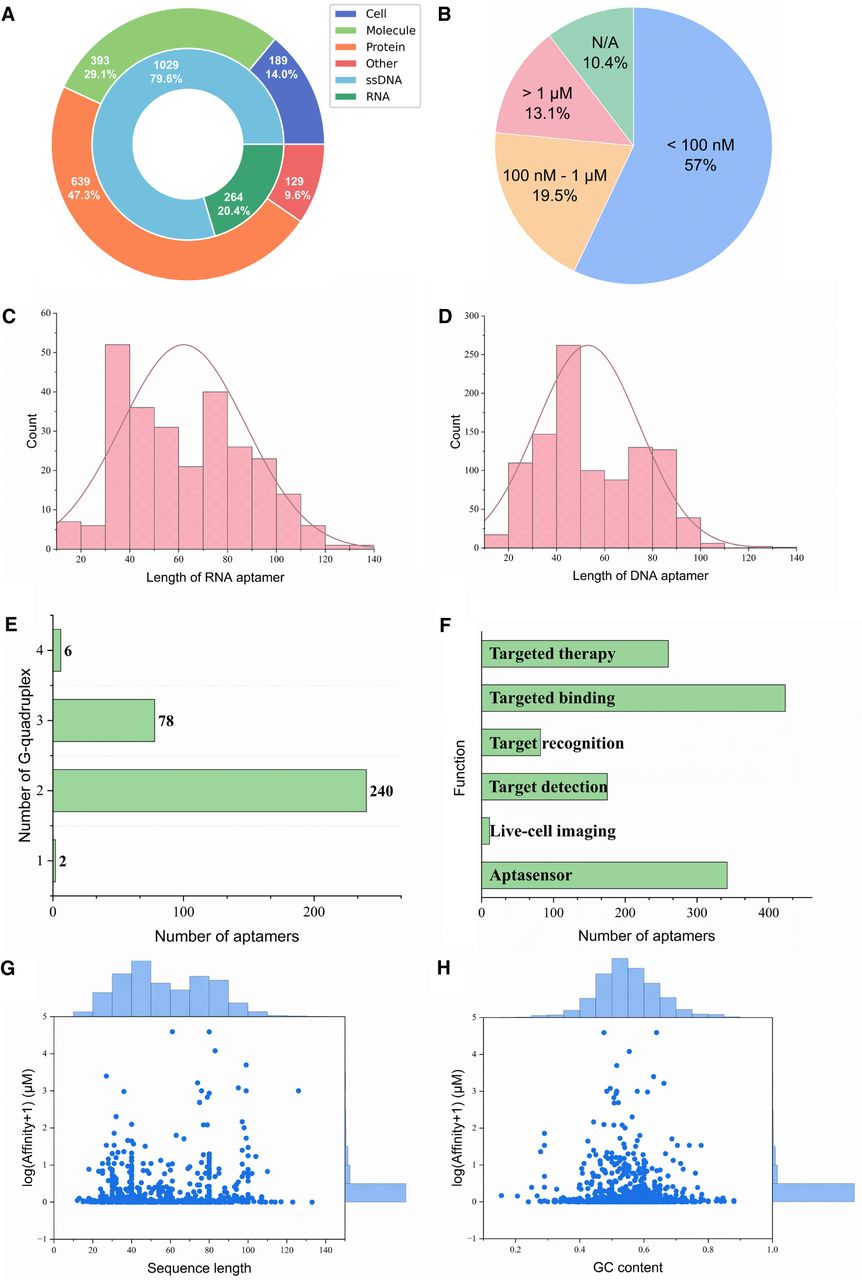
Statistics of AptaDB. (A) Percentage of RNA and ssDNA (inner circles) and percentage of different aptamer–target interactions (outer circles). (B) Distribution of affinity between aptamer and targets in AptaDB. (C) Distribution of RNA aptamer length. (D) Distribution of DNA aptamer length. (E) Distribution of aptamers with different numbers of G-quadruplex (prediction by QGRS mapper). (F) Distribution of the number of different aptamer functions. (G) Relationship between aptamer length and affinity. The affinity values have been logarithmically transformed using the formula log(affinity + 1) for smoother representation. (H) Relationship between GC content and affinity. The affinity values have been logarithmically transformed using the formula log(affinity + 1) for smoother representation.




