


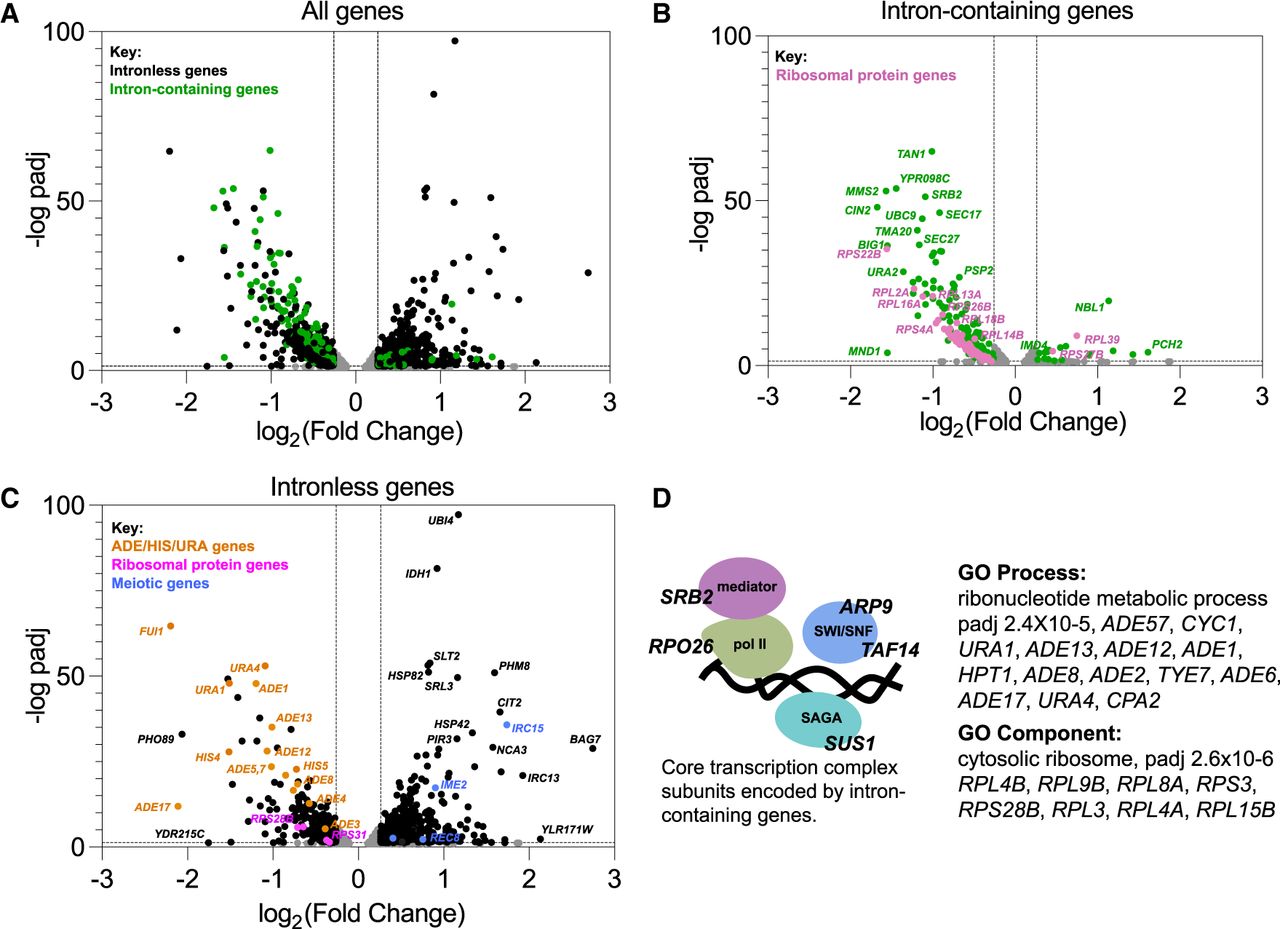
Impact of splicing inhibition on intronless genes. (A) Volcano plot showing differential gene expression analysis of the humanized hsh155-ds strain in 5 µM Plad-B compared to DMSO. Y-axis shows −log10 adjusted P-value and the x-axis shows log2 fold change in expression. Points not meeting P-value < 0.05 (−log Padj > 1.3) or log2 Fold Change = |0.26| (Fold Change = ±1.2) are gray. Both intron-containing (green) and intronless genes (black) are shown. (B) Same plot as in A but only shows intron-containing genes. RPGs are pink and non-RPGs are green. (C) Same plot as in A but only showing intronless genes. ADE/HIS/URA genes are in orange, RPGs are in pink, and meiotic genes are in blue. (D) GO analysis identifies the enrichment of the ribonucleotide metabolic process and the ribosome (component) in the set of down-regulated intronless genes. At left is a diagram of four key protein complexes required for chromatin state and transcription along with the names of intron-containing genes encoding at least one of their subunits.




