


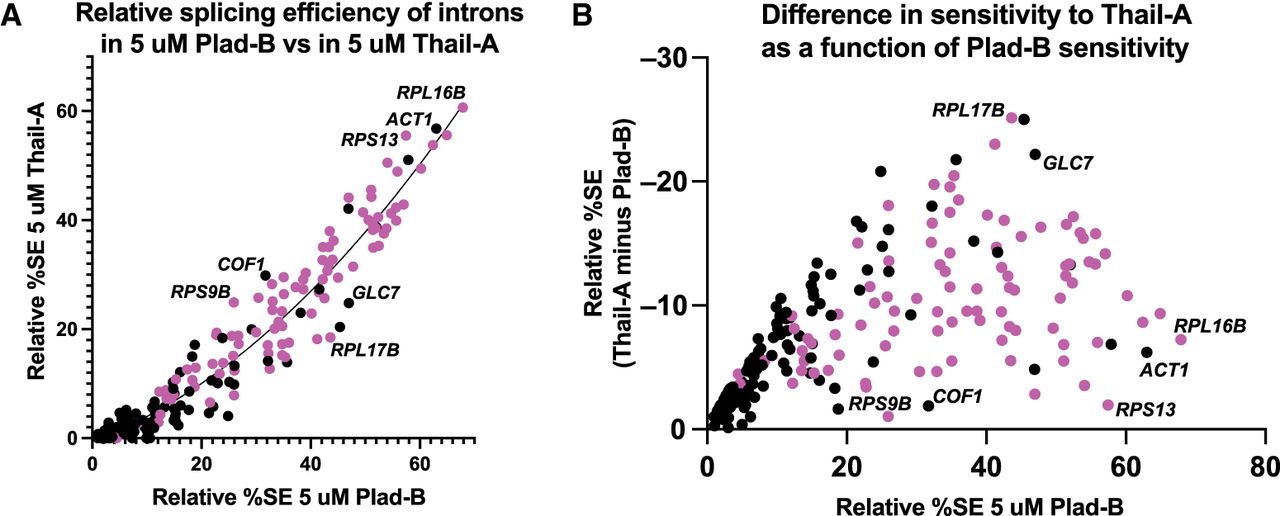
Introns respond differently to Plad-B and Thail-A. (A) Scatter plot comparing the relative SE of introns in 5 µM Plad-B (x-axis) compared to their relative SE in Thail-A (y-axis). As Thail-A is overall a more potent inhibitor than Plad-B at 5 µM, all introns are more sensitive to Thail-A. The regression line is derived from a nonlinear least squares fit. Pink dots are RPGs. Introns above this line are relatively less sensitive to Thail-A than to Plad-B as compared to the average intron, whereas those below the line are relatively more sensitive to Thial-A than Plad-B as compared to the average intron. (B) Relationship between sensitivity to Plad-B and the difference between Thail-A and Plad-B sensitivity. The y-axis represents the difference between the resistance to Thail-A and Plad-B; values are negative because Thail-A is a more potent inhibitor. A high position in the Y dimension indicates an intron whose sensitivity to Thail-A is much greater than to Plad-B, whereas those lower in the Y dimension have more similar sensitivities to both inhibitors.




