


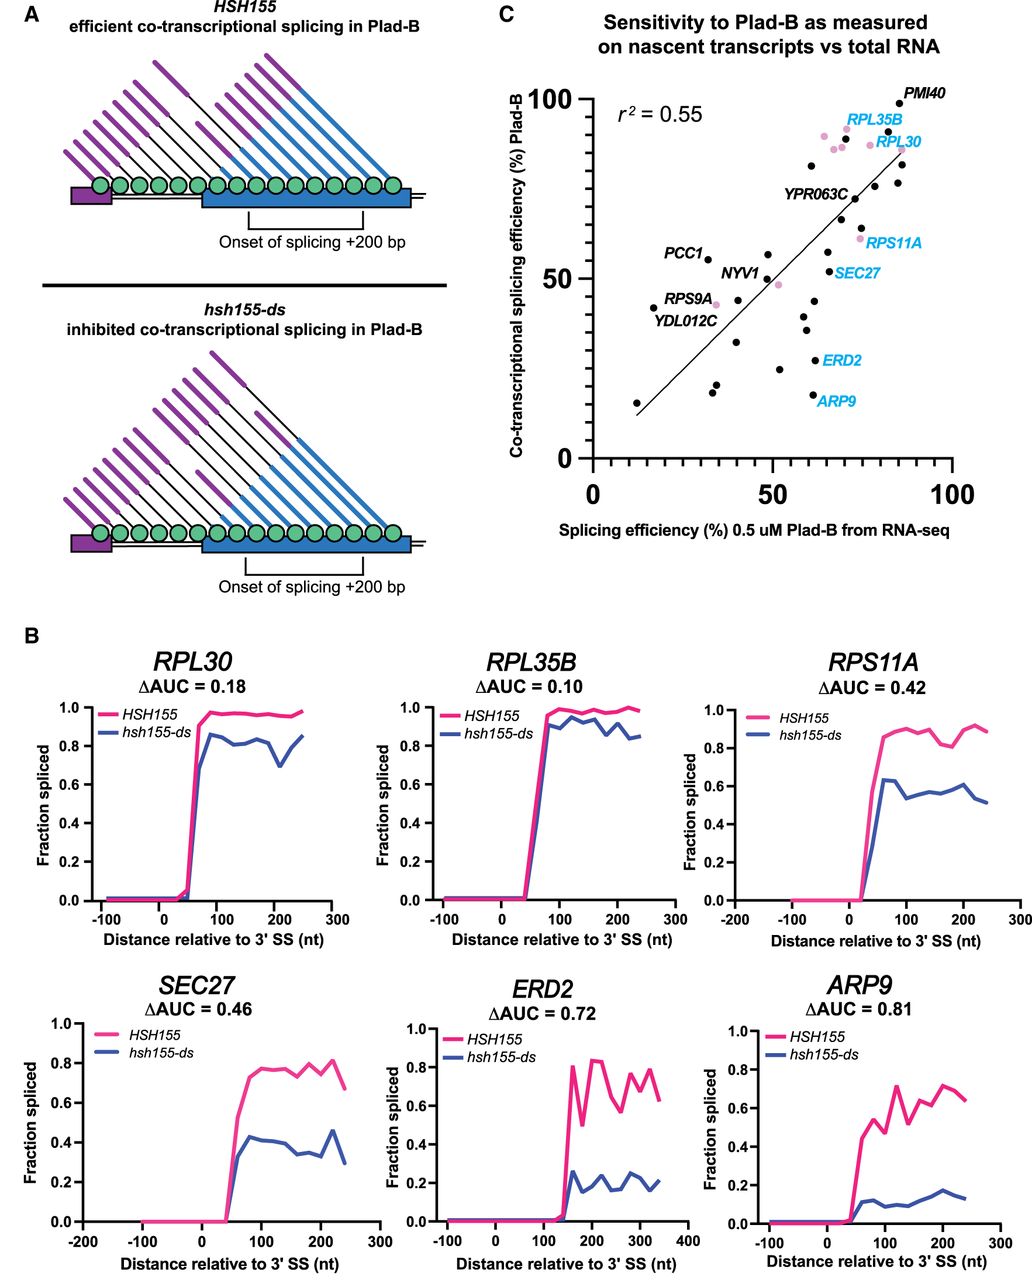
Intron-specific difference in Plad-B sensitivity during cotranscriptional splicing. (A) Model depicting cotranscriptional splicing in Plad-B for insensitive wild-type cells (top) and sensitive humanized cells (bottom). An example gene is represented by the horizontal boxes, with RNAP II shown as green circles moving left to right during transcription. Nascent transcripts extend from RNAP II and their splicing status is shown by the presence or absence of the intron (thin line). Exon 1 is purple, exon 2 is blue. The bracket below the gene shows the range of RNAP II positions from which nascent transcripts are counted to evaluate SE. Inhibition is detected by counting the fraction of nascent transcripts within this window that have had their introns removed. (B) Plots of fraction spliced versus RNAP II distance from the 3′SS for six genes. Pink line is WT HSH155 with 5 µM Plad-B; blue line is hsh155-ds with 5 µM Plad-B. The difference of the normalized area under the curve values (ΔAUC) is shown. (C) Plot of SE in 0.5 µM Plad-B measured using RNA-seq of total RNA with cotranscriptional SE in Plad-B as measured by SMIT for 37 genes. Pink points are RPGs; genes plotted in B are shown in blue.




