


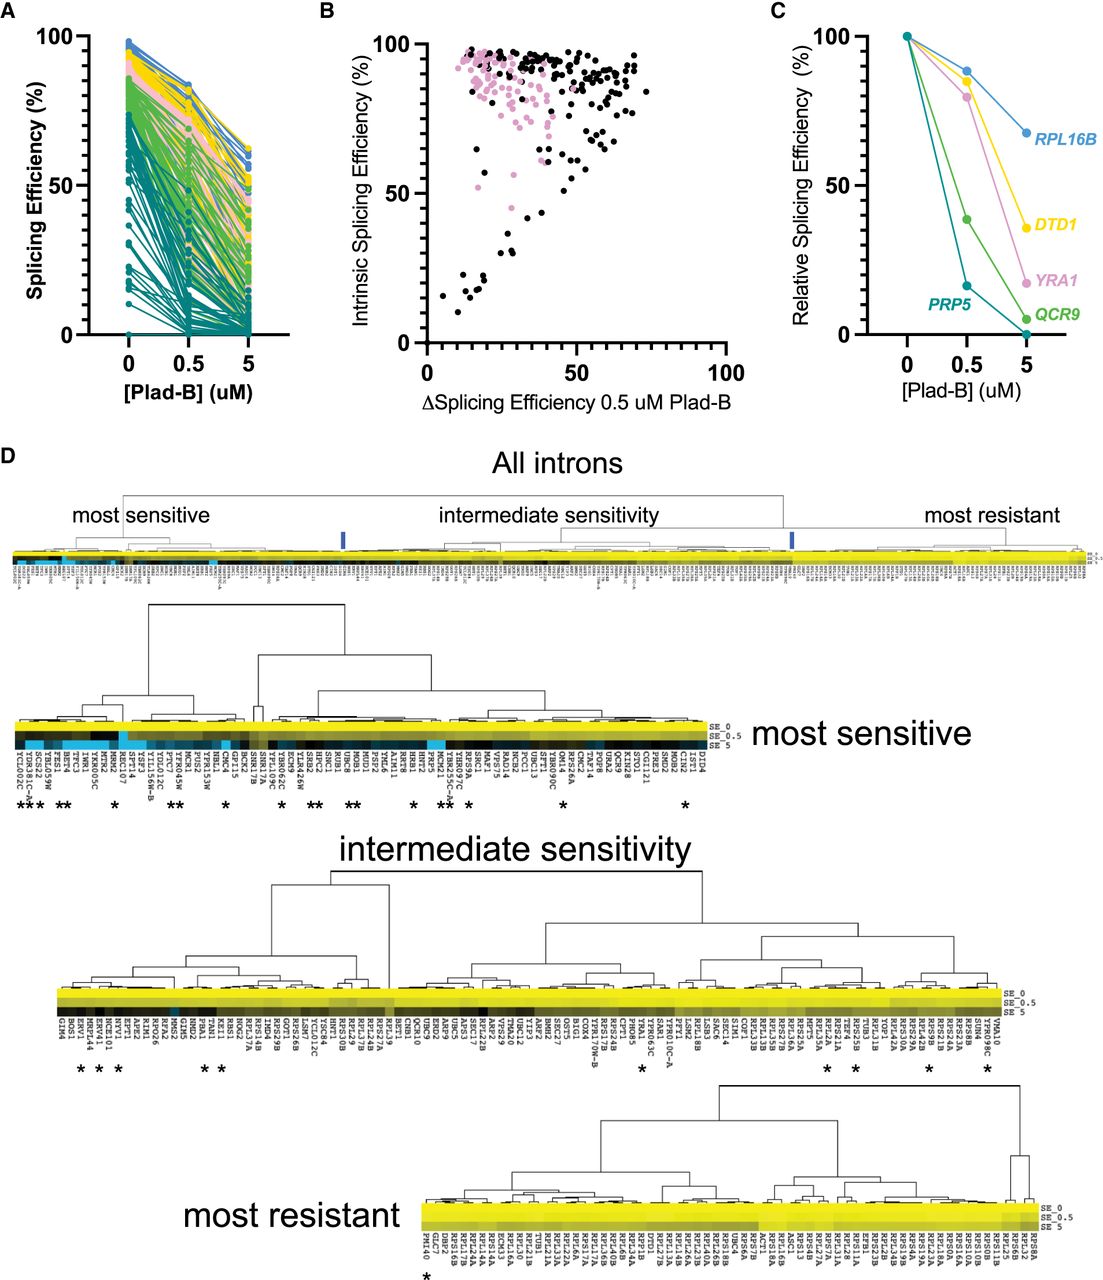
Introns can be classified by their sensitivity to Plad-B. (A) Splicing efficiency (SE) dose-response curves for all 247 introns analyzed at 0, 0.5, and 5 µM Plad-B for the humanized strain. The data have been separated into quintiles and color-coded: Blue represents quintile 1 (most efficient), gold represents quintile 2, pink represents quintile 3, green represents quintile 4, and teal represents quintile 5. (B) Scatter plot comparing Plad-B sensitivity (the difference in SE between 0 and 0.5 µM Plad-B) with the intrinsic SE of the uninhibited introns (0 Plad-B, DMSO). Pink dots represent RPG introns. For introns >75% intrinsic SE versus ΔSE in 0.5 µM Plad-B, r2 = 0.08. (C) Relative SE dose-response for six representative genes. The data shown in (A) have been normalized to hsh155-ds DMSO sample as described in Materials and Methods. (D) Hierarchical clustering of relative SE dose-response curves for single-intron genes. Cluster nodes were used to call intron groups as “most sensitive,” “intermediate sensitivity,” and “most resistant.” Color indicates sensitivity to Plad-B, with yellow being the most resistant, black being intermediately sensitive, and blue being the most sensitive. The top panel shows the complete set with the lower panels showing the groups. Introns with nonconsensus BP sequences are marked with asterisks.




