


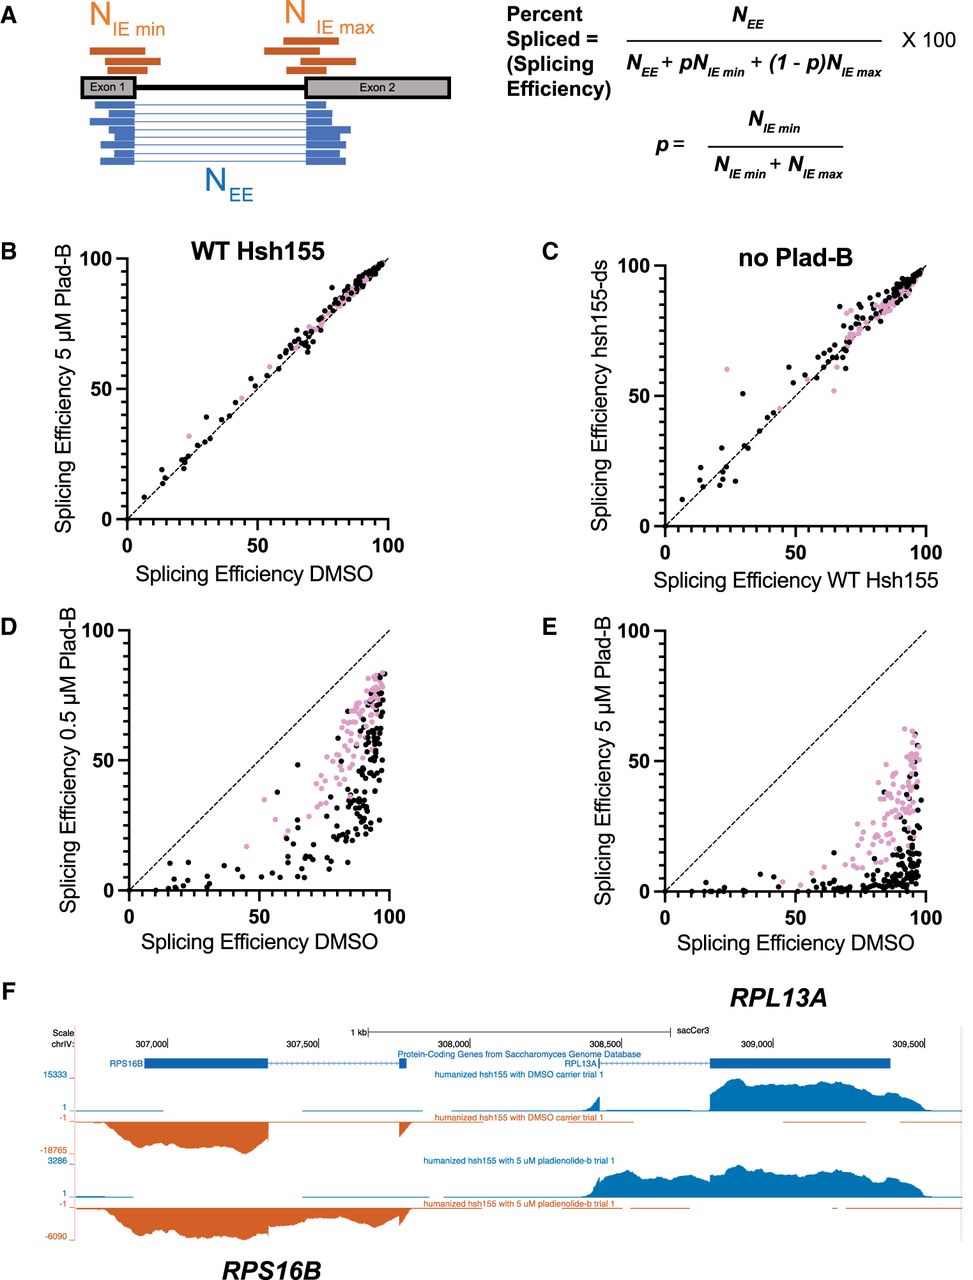
Comparisons of SE under different genetic conditions and drug treatments. (A) Splicing efficiency is calculated as percent spliced using junctionCounts (see Materials and Methods). Reads spanning the splice junction (NEE, blue) and the unprocessed splice sites (NIE, orange) were used to calculate a percent spliced value as shown using the equations on the right. (B) Scatter plot comparing SE for each intron in wild-type cells incubated with either DMSO (x-axis) or 5 µM Plad-B (y-axis). (C) Scatter plot comparing SE for each intron in wild-type cells (x-axis) or in hsh155-ds (y-axis) cells without the drug (DMSO only). (D,E) Scatter plots comparing SE for each intron in hsh155-ds cells treated only with DMSO (x-axis), 0.5 µM (D), or 5 µM (E) Plad-B (x-axis). In panels B–E, pink dots represent ribosomal protein genes. (F) Normalized read coverage tracks over part of the yeast genome encoding divergently transcribed genes RPS16B (bottom strand right to left, orange) and RPL13A (top strand left to right, blue). Top track shows ORF locations, middle track shows humanized strain expression in DMSO (no drug), bottom track shows humanized strain expression after 1 h in 5 µM (Plad-B). Note accumulation of intron reads in the Plad-B-treated sample. Browsable coverage data may be found at https://genome.ucsc.edu/s/mannyares/Hunter_etal.




