


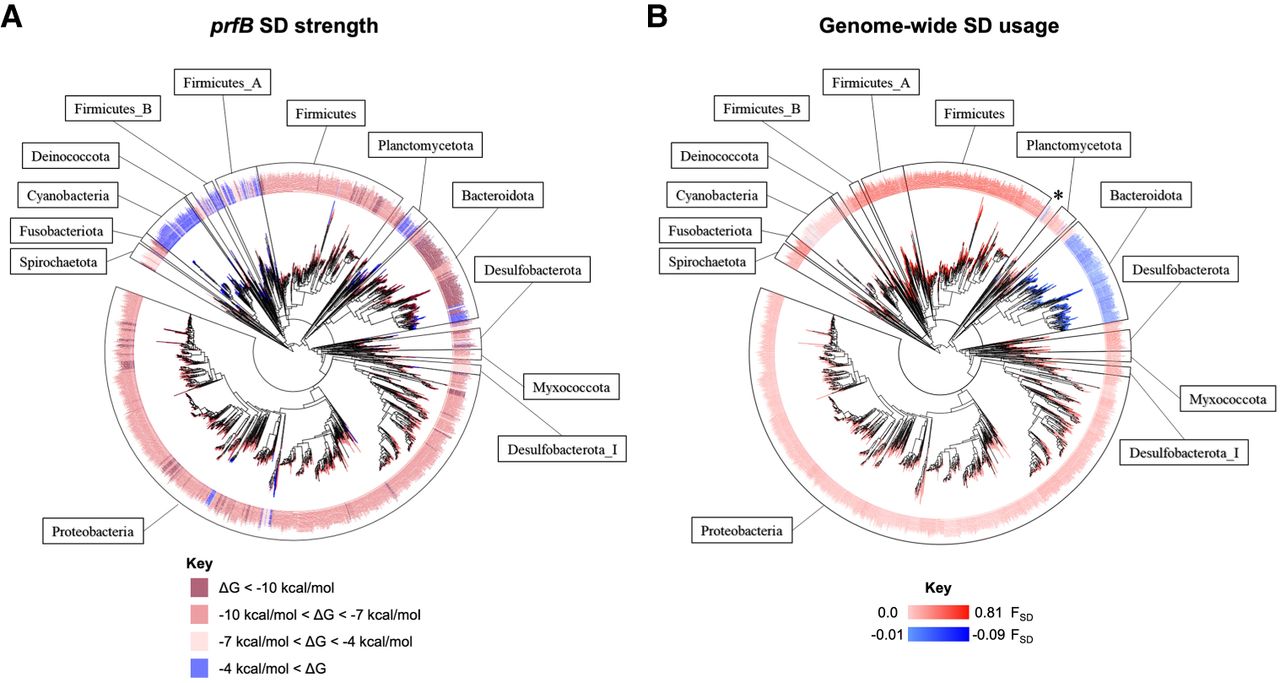
Degeneration of the prfB SD sequence in certain clades of bacteria. (A) Phylogenetic tree of 2763 bacterial species with FS-containing prfB. The leaves are colored according to the free energy of pairing between the ASD and SD of the FS site: dark red, ΔG < −10 kcal/mol; light red, −10 kcal/mol < ΔG < −7 kcal/mol; pink, −7 kcal/mol < ΔG < −4 kcal/mol; blue, −4 kcal/mol < ΔG. (B) Phylogenetic tree of the same bacterial species but with leaves colored by overall SD usage across the respective genomes. Red indicates higher SD usage than expected by chance, with FSD values ranging from 0.0 (lightest tint) to 0.81 (darkest shade). Blue indicates lower SD usage than expected by chance, with FSD values ranging from −0.01 (lightest tint) to −0.09 (darkest shade). Phyla with ≥25 representative organisms are indicated. The Verrucomicrobiales are marked with an asterisk.




