


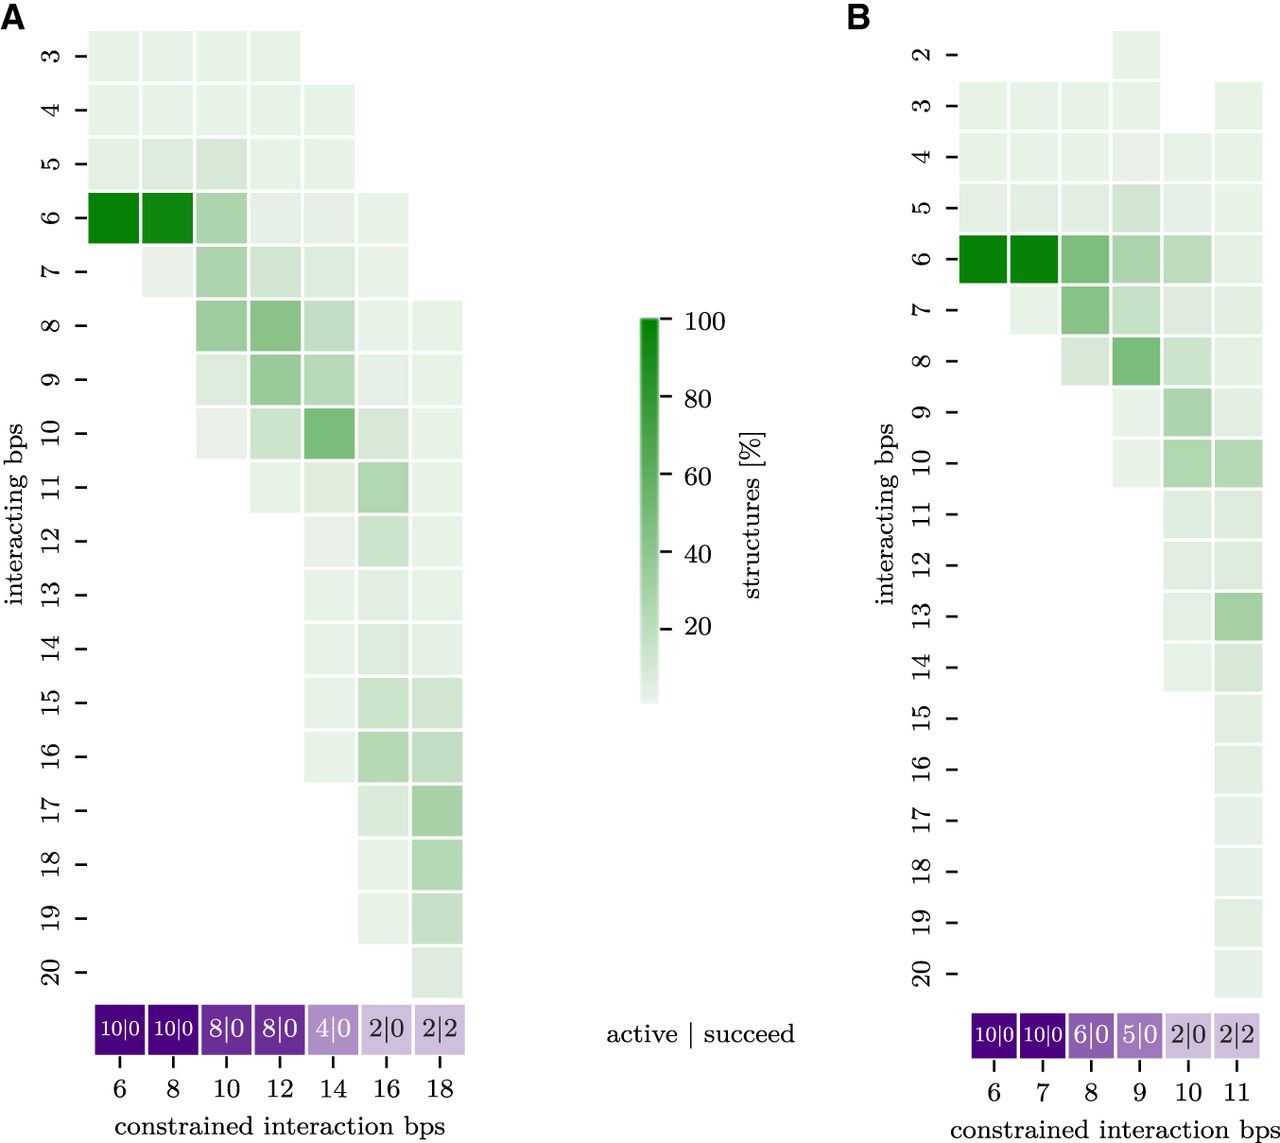
FIGURE 5.
(A) Setting I. Symmetric interaction extension of the HIV-1 DIS interaction site with nstep = 1 million. Each column shows the histogram (green) of interaction lengths including loops (y-axis) at the corresponding constrained interaction length in bp (x-axis). For every elongation step (corresponding to a number of constrained interaction base pairs), the purple box reports firstly the number of still active runs (from a total of 10); and secondly, the number of runs that successfully reach the full duplex. (B) Setting II with an asymmetric interaction extension.




