


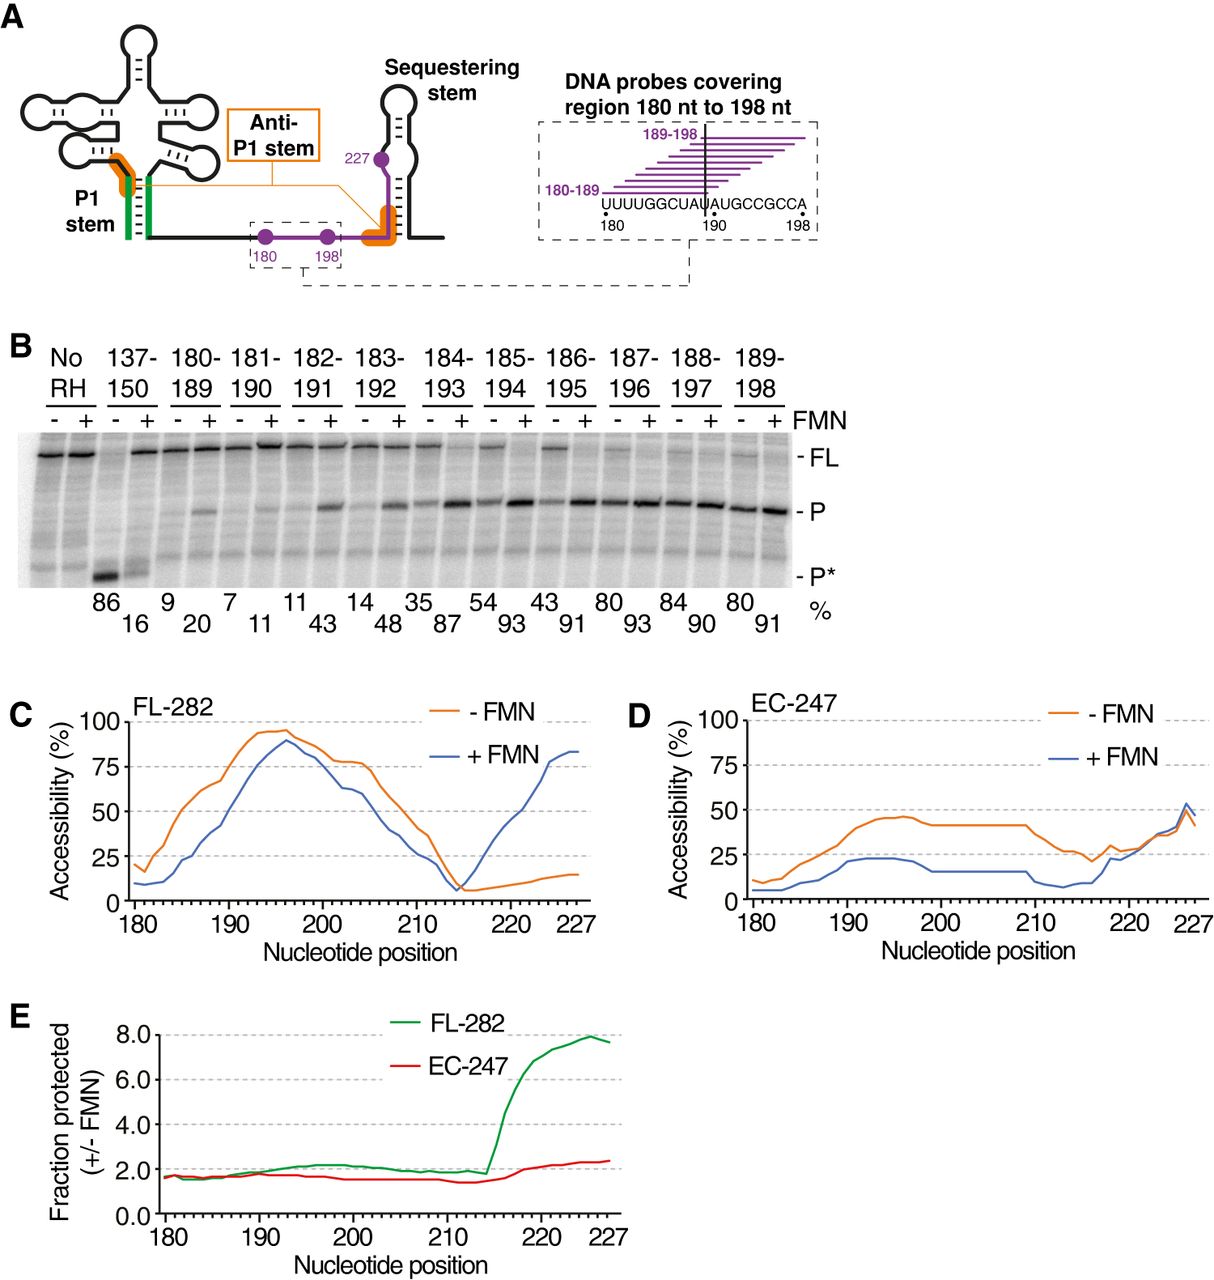
RNase H assays of the region 180–227 nt using FL transcripts and transcription complexes located at position 247. (A) Schematic representing the ribB riboswitch and the region 180–227 nt probed using RNase H assays (depicted in purple). The inset shows an example of DNA probes used to monitor the region 180–198 nt. For each RNA residue analyzed, overlapping DNA probes may be used to deduce an average RNase H accessibility. For example, the average of RNase H cleavage efficiency for position 189 is calculated using probes 180–189. (B) RNase H probing assays obtained on the FL ribB nascent transcripts without (−) and with (+) 100 µM FMN. The regions targeted by the DNA probes in each experiment are indicated at the top of the gel. The FL and cleaved products (P and P*) are indicated on the right of the gel. The length of the P* product obtained with the 137 probe is shorter than what was obtained with the other probes due to the targeted location on the transcript. Control experiments performed without RNase H (No RH) are shown on the left. RNase H assays were performed in the presence and absence of FMN using each probe. The most representative data are shown on the gel. (C,D) RNase H probing accessibility profiles for the ribB FL 282 nt transcript (C) or when in the EC-247 complex (D). The accessibility profile obtained without (−) and with (+) FMN is shown as a function of nucleotide position. For each position, the average of RNase H cleavage efficiency was calculated using the efficiencies obtained from all probes targeting the position. RNase H assays were performed in the presence and absence of FMN using each probe. The averages of overlapping probes are shown. (E) The fraction protected from RNase H cleavage by the binding of FMN as a function of nucleotide position in the context of FL transcripts (green) or in EC-247 (red). The fraction was obtained by performing a ratio of the averages of RNase H cleavage efficiencies obtained without and with FMN. RNase H assays were performed in the presence and absence of FMN using each probe. The averages of overlapping probes are shown.




