


Exploring the energetic and conformational properties of the sequence space connecting naturally occurring RNA tetraloop receptor motifs
- John H. Shin1,2,
- Lena M. Cuevas3,
- Rohit Roy4,
- Steve L. Bonilla5,
- Hashim Al-Hashimi6,
- William J. Greenleaf7,8,9 and
- Daniel Herschlag1,2,10
- 1Department of Biochemistry, Stanford University, Stanford, California 94305, USA
- 2Department of Chemical Engineering, Stanford University, Stanford, California 94305, USA
- 3Department of Chemistry and Chemical Biology, Cornell University, Ithaca, New York 14850, USA
- 4Center for Genomic and Computational Biology, Duke University School of Medicine, Durham, North Carolina 27710, USA
- 5Laboratory of RNA Structural Biology and Biophysics, The Rockefeller University, New York, New York 10065, USA
- 6Department of Biochemistry and Molecular Biophysics, Columbia University, New York, New York 10032, USA
- 7Department of Genetics, Stanford University, Stanford, California 94305, USA
- 8Department of Applied Physics, Stanford University, Stanford, California 94305, USA
- 9Chan Zuckerberg Biohub, San Francisco, California 94158, USA
- 10Chem-H Institute, Stanford University, Stanford, California 94305, USA
- Corresponding author: herschla{at}stanford.edu
-
Handling editor: Eric Westhof
Abstract
Folded RNAs contain tertiary contact motifs whose structures and energetics are conserved across different RNAs. The transferable properties of RNA motifs simplify the RNA folding problem, but measuring energetic and conformational properties of many motifs remains a challenge. Here, we use a high-throughput thermodynamic approach to investigate how sequence changes alter the binding properties of naturally occurring motifs, the GAAA tetraloop • tetraloop receptor (TLR) interactions. We measured the binding energies and conformational preferences of TLR sequences that span mutational pathways from the canonical 11ntR to two other natural TLRs, the IC3R and Vc2R. While the IC3R and Vc2R share highly similar energetic and conformational properties, the landscapes that map the sequence changes for their conversion from the 11ntR to changes in these properties differ dramatically. Differences in the energetic landscapes stem from the mutations needed to convert the 11ntR to the IC3R and Vc2R rather than a difference in the intrinsic energetic architectures of these TLRs. The conformational landscapes feature several nonnative TLR variants with conformational preferences that differ from both the initial and final TLRs; these species represent potential branching points along the multidimensional sequence space to sequences with greater fitness in other RNA contexts with alternative conformational preferences. Our high-throughput, quantitative approach reveals the complex nature of sequence-fitness landscapes and leads to models for their molecular origins. Systematic and quantitative molecular approaches provide critical insights into understanding the evolution of natural RNAs as they traverse complex landscapes in response to selective pressures.
Keywords
INTRODUCTION
Structured RNA molecules perform critical roles in biology as enzymes, regulators, and scaffolding for ribonuclear protein complexes (Zhang and Doudna 2002; Zappulla and Cech 2004; Vicens and Cech 2006; Strobel and Cochrane 2007; Ponting et al. 2009; Chadee et al. 2010; Halvorsen et al. 2010; Mustoe et al. 2014; Roth et al. 2014; Ganser et al. 2019; Mauger et al. 2019; Phan et al. 2021). There has been considerable focus on predicting RNA tertiary structure, and recent efforts have been fueled by the remarkable success of AlphaFold and related machine-learning approaches in providing accurate three-dimensional (3D) models for nearly all folded proteins (Cruz et al. 2012; Baek et al. 2021; Jumper et al. 2021; Das et al. 2023; Lin et al. 2023; Schneider et al. 2023; Abramson et al. 2024). Nevertheless, structure prediction alone is insufficient to describe the biological function of RNAs. RNA function is not directly tied to a single structure, rather it depends on the conformational ensemble sampled by the RNA. There is therefore a critical need for deep, quantitative (and ultimately predictive) understanding of the energetic properties of RNA and its conformational landscape. Fortunately, RNAs have structural and energetic properties that simplify their study and can be used to obtain insights into their fundamental properties.
Structured RNAs consist of highly stable secondary structures and sparse tertiary contacts that simplify their study, unlike their protein counterparts (Brion and Westhof 1997; Baldwin and Rose 1999; Batey et al. 1999; Silverman et al. 1999; Russell et al. 2002; Mathews et al. 2010; Bisaria et al. 2017; Herschlag et al. 2018). RNA molecules tend to fold hierarchically such that the problems of secondary and tertiary structure formation can largely be treated separately (Herschlag 1995, 2018; Bisaria et al. 2017). Secondary structure is predominantly governed by the interaction of base-pairing residues and their nearest neighbors (Turner et al. 1988; Brion and Westhof 1997; Herschlag et al. 2018; Yesselman et al. 2019b; Shi et al. 2020). Tertiary contacts that connect distal regions in primary and secondary sequence often behave as motifs; these motifs exhibit common 3D structures when embedded in multiple complex RNAs (Pley et al. 1994; Costa and Michel 1995; Costa et al. 1997; Batey et al. 1999; Klein et al. 2001; Rozhdestvensky et al. 2003; Ishikawa et al. 2011; Zhang et al. 2011; Mládek et al. 2012; Denny et al. 2018; Huang and Lilley 2018). Further, RNA motifs are energetically modular, as the same energetic effects are observed upon mutation or changing conditions when the same motif is embedded in different RNA scaffolds (Bisaria et al. 2017; Denny et al. 2018; Herschlag et al. 2018; Bonilla et al. 2021; Shin et al. 2023).
We emphasize modularity as it lies at the heart of building generalizable models for complex systems in science and allows insights obtained by studying a particular module to be applied in broader contexts (Hartwell et al. 1999; Csete and Doyle 2002; Hendrix et al. 2005; Guttman and Rinn 2012; Hayden et al. 2015). Modularity in RNA tertiary structure implies that the stability and conformational properties of tertiary motifs can be used to “reconstitute” and predict the properties of the full RNA, precepts that are the foundations of the RNA reconstitution model (Bisaria et al. 2017; Herschlag et al. 2018).
Practically, a large number of high-quality measurements are needed to provide information of sufficient depth and breadth to dissect and understand the properties and behavior of RNA motifs. The quantitative analysis of RNA on a massively parallel array developed by Greenleaf and coworkers allows the measurement of thermodynamic parameters for tens of thousands of RNA motifs of interest (Buenrostro et al. 2014; She et al. 2017; Denny et al. 2018; Yesselman et al. 2019a; Bonilla et al. 2021; Shin et al. 2023). We previously used this method to investigate the energetic and conformational properties of a ubiquitous family of RNA tertiary contact motifs known as GNRA tetraloop • tetraloop receptors (TL • TLRs) (Bonilla et al. 2021; Shin et al. 2023) (Fig. 1; Supplemental Fig. S1). We found that TLRs cluster into classes with common TL specificities and conformational preferences, and we also found that sequence variation within classes weaken the tertiary contact without altering their conformational preferences. In particular, the quintessential 11 nt receptor (11ntR) (Fig. 1A; Jaeger et al. 1994; Murphy and Cech 1994; Costa and Michel 1995; Cate et al. 1996) and its variants preferentially bind to the GAAA TL (Costa and Michel 1997; Ikawa et al. 2001; Geary et al. 2008), whereas the TLRs found in the V. cholera c-di-GMP riboswitch (Vc2R) (Fig. 1B; Weinberg et al. 2007; Roth and Breaker 2009; Smith et al. 2010), the Group IC3 intron (IC3R) (Fig. 1C; Ikawa et al. 1999, 2001), and their sequence variants form a class of TLRs that do not discriminate between GAAA and other TLs such as GUAA (Ikawa et al. 2001; Geary et al. 2008; Ishikawa et al. 2011; Fiore and Nesbitt 2013). This discrimination appears to stem from an interaction between 2TLA in the GAAA and A8 in the 11ntR that is missing in the Vc2R and IC3R (Fig. 1; Cate et al. 1996; Golden et al. 2005; Smith et al. 2009; Zakrevsky et al. 2021). In-depth mutational analyses revealed that the residues within the 11ntR exhibit a mix of cooperative and additive energetic properties, with cooperativity dominating proximal groups and additivity dominating groups that are distal in 3D space in the TLR structure (Shin et al. 2023).
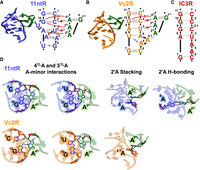
Structured RNA molecules contain modular tertiary contact motifs. (A) Structure and sequence of the 11ntR from the P4–P6 domain of the Tetrahymena Group I intron; PDB: 1GID (Cate et al. 1996). Base pairs are denoted by the Leontis–Westhof notation (Leontis and Westhof 2001), and intermolecular hydrogen bonds are denoted by red lines; intermolecular stacking interactions are denoted by dotted red lines. The residues are numbered in accordance with Bonilla et al. (2017), and the loop residues of TL are numbered with superscript “TL” to distinguish them from TLR residues. (B) Structure and sequence of Vc2R in the V. cholera c-di-GMP riboswitch; PDB: 3MXH (Smith et al. 2010). Intermolecular interactions are shown as in (A), and the residues are numbered to correspond to the 11ntR. (C) The sequence of IC3R; its putative base pairs based on homology with Vc2R are shown as dotted lines (Zakrevsky et al. 2021). (D) Interactions between the GAAA tetraloop (green) and the 11ntR (blue) or Vc2R (orange). Interactions are depicted by dashed lines. Residues of the TLR are numbered and color coded as depicted in A–C.
The prior quantitative high-throughput biophysical studies extensively described the properties of known TLRs, but of necessity consisted of only a small sampling of the overall TLR sequence space. In particular, the nature of how the properties of TLR variants emerge from or change with sequences remains uninvestigated. Given the immense size of the total TLR sequence space (107 possible 11 or 12 nt sequences) compared to the feasibility limits of the high-throughput assay (103–104 sequences), we chose to explore a subset of the overall sequence space consisting of the mutational pathways from the 11ntR to the IC3R and Vc2R (Fig. 2A,B). As the IC3R and Vc2R share binding properties (energy and conformation) that differ from the 11ntR, these mutational pathways report on how different TLR-binding properties arise from the TLR sequence. Our results suggest that the sequence-energy and sequence-conformation landscapes are not readily parameterized by simple measures such as edit distance from the starting point; rather, specific mutations and sequence intermediates shape the landscapes in complex manners. These idiosyncrasies are interpretable in terms of the underlying molecular interactions in these motifs, highlighting the importance of integrating energetics and molecular models in understanding the sequence landscapes of RNAs, and consequently their function and evolution.
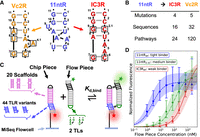
Library design and array experiment. (A,B) Conversion from the 11ntR to the IC3R (red) or Vc2R (orange) involves four or five mutations and 16 or 32 sequence variants, respectively. These variants can be arranged in 24 or 120 single-mutant pathways (Supplemental Fig. S2). (C) Schematic of the array experiment (Buenrostro et al. 2014; She et al. 2017; Denny et al. 2018). A library of chip piece hairpin sequences is sequenced and transcribed on an Illumina MiSeq flowcell. The chip piece library contains 20 scaffold sequences (pink) and 44 TLR variants (blue) spanning mutational pathways from the 11ntR to the IC3R and Vc2R, resulting in a total of 880 unique sequences. The TLR variants (blue) and a GGAA tetraloop (black) in the chip piece bind to a GAAA or GUAA TL (green) and an R1 TLR (black) in a flow piece hairpin that is flowed onto the MiSeq flowcell. The two tertiary contacts facilitate binding of the flow piece to the immobilized chip piece hairpins. Titrating a fluorescently labeled flow piece RNA allows for the fitting of isothermal binding isotherms. (D) Example binding isotherms for three TLR sequences: the wt 11ntR (blue; n = 68 clusters), an 11ntR mutant (green; n = 46 clusters) and the wt IC3R (red; n = 78 clusters). Points represent the median fluorescence across all sequence clusters on the flowcell, with error bars depicting the 95% confidence interval (CI) obtained via bootstrap analysis. The fit isotherms are depicted as lines going through the data points, with the 95% error interval shaded.
RESULTS
TLR anchors and library design
The 11ntR, IC3R, and Vc2R (Fig. 1A–C) were chosen to anchor our exploration of the TLR landscape due to their extensive prior study (Costa and Michel 1995; Ikawa et al. 1999, 2001; Weinberg et al. 2007; Geary et al. 2008; Roth and Breaker 2009; Smith et al. 2010; Bisaria and Herschlag 2015; Bonilla et al. 2017, 2021; Shin et al. 2023). We sampled the landscape spanning these receptors by investigating each stepwise sequence of mutations from the 11ntR to the two other TLRs, focusing on the shortest mutational pathways between the TLR sequences. We substituted each residue of the “left” strand (residues 7–11, Fig. 2A) and, since the “right” strand of the 11ntR (residues 1–6, Fig. 2A) has one fewer nucleotide than the two other receptors, we inserted a residue to the right strand in addition to substitutions at other positions. To keep numbering consistent, we denote inserted residues as “X.1” (Fig. 2A). There are four changes between the 11ntR and IC3R that lead to four single, six double, and four triple mutants from the 11ntR in addition to the wild-type (wt) 11ntR and IC3R. These 16 sequences define 24 single-mutation pathways spanning the TLRs (Fig. 2A,B; Supplemental Fig. S2A). Five mutations span the 11ntR and Vc2R receptors, leading to 32 sequences and 120 pathways (Fig. 2A,B; Supplemental Fig. S2B). Four of the sequences overlap between the pathways, resulting in 44 unique TLR sequences studied herein.
We utilized the tectoRNA scaffold to study the binding energies and conformational properties of the TLR variants in high-throughput on the array platform (Westhof et al. 1996; Jaeger and Leontis 2000; Jaeger et al. 2001; Ishikawa et al. 2013; Denny et al. 2018; Mitchell et al. 2019; Yesselman et al. 2019a; Bonilla et al. 2021; Shin et al. 2023). The tectoRNA is a heterodimer of RNA hairpins containing two orthogonal TL • TLR pairs that form contacts between the hairpins (Fig. 2C; Jaeger and Leontis 2000; Jaeger et al. 2001). We inserted our library of TLR variants (Fig. 2C, blue) in the “chip piece” hairpin, where it binds to the TL (Fig. 2C, green) in the complementary “flow piece” hairpin. The main flow piece contained a GAAA TL to bind to the above TLRs, and an alternative flow piece contained a GUAA TL; both flow pieces contained the R1 TLR which forms an orthogonal TL • TLR interaction with the GGAA TL in the chip piece to complete formation of the tectoRNA dimer (Fig. 2C, black; Jaeger et al. 2001; Mitchell et al. 2019).
The chip piece hairpin contains a variable “scaffold” region between the TLR and TL (Fig. 2C, pink), which enabled us to sample a range of binding geometries between the TLR and its corresponding flow piece TL and obtain information about the TL • TLR conformational landscape. In this study, we used 20 scaffold sequences for a total library of 880 unique chip piece sequence variants (Supplemental Fig. S3). Binding studies were carried out with the GAAA and GUAA flow pieces in the presence and absence of K+; the effects of K+ on binding were assessed since the 11ntR contains a K+ binding pocket that strengthens the tertiary contact whereas the Vc2R and IC3R do not (Basu et al. 1998; Davis et al. 2007; Lambert et al. 2009; Bonilla et al. 2021; Shin et al. 2023). With the addition of an experimental replicate, we acquired a total of 4400 binding measurements, as described below and in the Materials and Methods.
RNA array data collection and analysis
We obtained quantitative binding measurements for our library of TLR variants via the previously described quantitative analysis of RNA on a massively parallel array developed by Greenleaf and coworkers (Buenrostro et al. 2014; She et al. 2017; Denny et al. 2018; Yesselman et al. 2019a; Bonilla et al. 2021; Shin et al. 2023). The 44 TLR x 20 scaffold sequence variants were encoded in a DNA library that was transcribed to RNA on an Illumina MiSeq flowcell (Fig. 2C). The library concentration was controlled to facilitate the generation of multiple “clusters” of chip piece hairpins across the flowcell to serve as technical replicates. We then performed equilibrium tectoRNA binding measurements with the fluorescently labeled flow piece hairpin to measure binding constants for each library construct (Fig. 2D). These experiments were repeated under four different conditions to assay binding of the TLR variants to either a GAAA or GUAA tetraloop in the presence or absence of K+. For statistical rigor, we fit isotherms for library variants that had five or more replicate clusters on the flowcell as previously described (Denny et al. 2018) (705-770 of 880 constructs over the experiments, Supplemental Fig. S4).
The resulting binding free energies (ΔG = –RT ln Keq) were used to calculate ΔΔG values relative to a reference TLR, the wt 11ntR. The ΔΔG values were largely similar across scaffolds, with a subset of scaffolds having significant different ΔΔG values that reflect different geometric preferences of the TLR (see Conversion pathways on TLR sequence-conformation landscapes below). Additionally, several of the scaffolds were destabilizing and resulted in no observable binding for at least a subset of the TLR variants, limiting quantitative comparisons of binding affinities. To improve precision, we report ΔΔG values averaged over a subset of scaffolds that facilitate strong tectoRNA binding (Supplemental Fig. S7). The effects from conformational changes were separately ascertained by utilizing ΔΔG values for each scaffold.
Topographies of TLR sequence-energy landscapes
The IC3R and Vc2R share energetic and structural properties that are different from those of the 11ntR: They bind more weakly to the GAAA TL and have broader conformational landscapes (Bonilla et al. 2021). The structure of the GAAA • Vc2R reveals fewer interactions than those found in the GAAA • 11ntR, presumably the origin of its weaker binding and greater flexibility (Fig. 1D; Fujita et al. 2012). Although no X-ray structure is available for the GAAA • IC3R complex, it has been proposed to make the same base pairs and same interactions as the GAAA • Vc2R (Fig. 1C; Zakrevsky et al. 2021).
In the simplest case, the similar properties of the Vc2R and IC3R TLRs would translate into similar sequence-energy landscapes spanning from the 11ntR to the IC3R and Vc2R. Such a scenario might involve a steady decrease in binding as the 11ntR is mutated (and interactions are removed) until a point at which additional mutations lead to the formation of new interactions that increase binding in a new energy well. The results described below indicate this simple scenario holds for one of the transition landscapes but not the other. These and additional sequence-binding data combined with structural information give rise to molecular explanations for these differences.
The conversion from the 11ntR to the IC3R follows the simple case of a steady decrease and subsequent increase in binding across the sequence landscape. The 11ntR and IC3R differ by four mutations, with 24 possible pathways for conversion between them (Fig 2A,B). In all but two pathways, binding energy is sequentially lost until the weakest intermediate at the third mutation, after which a final mutation leads to tighter binding in the IC3R (Fig. 3A,B, red); the remaining two pathways had similarly weak binding in the second and third mutations (Fig. 3C). We calculated ΔΔG of intermediate TLRs from the previous intermediate (ΔΔGmut) to assess the effect of each mutation at different points along the mutational pathways (Fig. 3E). The first mutation decreases binding by 1.5 kcal/mol regardless of which mutation is made. At the second step, ΔΔGmut values for each mutation are the same or larger than when it was made first, e.g., the effects of double mutations are additive or compounded to be more deleterious to binding. For the third mutation, the effects are also deleterious (or minimal in one case), but each mutation has a smaller effect than when they were made first or second, suggesting that cooperative interactions are broken or partially broken after the first two mutations. At the last (fourth) step, the mutations that were previously deleterious are now favorable such that all four mutations (whichever is added last) give rise to stronger binding. The shape of this energy landscape suggests that new cooperative interactions are formed in the final IC3R step, but not in earlier steps. Alternatively, the bound TL • TLR complex could consist of two states, an 11ntR-like state and an IC3R-like state, such that mutations create new cooperative interactions in the IC3R-like that are not observed due to stronger binding in the 11ntR-like state until all four mutations are made and IC3R-like binding is favored over 11ntR-like binding.
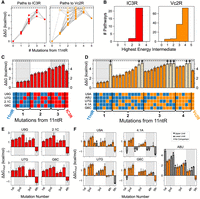
The sequence-energy landscape between naturally occurring TLRs. (A) The sequence-energy landscape for the 11ntR → IC3R conversions (red) and 11ntR → Vc2R conversions (orange) parameterized by the number of mutations from the 11ntR along the x-axis. The y-axis represents ΔΔG relative to the 11ntR (averaged over tectoRNA scaffolds). Each point represents a TLR variant along the conversion landscape, with open circles depicting lower limits for the ΔΔG value. Gray lines connect TLR variants that lie on the same mutational pathway. (B) Distribution of the highest energy intermediate along the mutational pathways from 11ntR to IC3R (left, red) and Vc2R (right, orange). (C,D) The ΔΔG values for TLR sequences along the 11ntR → IC3R pathways (C, red) or the 11ntR → Vc2R pathways (D, orange). ΔΔG values are relative to the 11ntR and averaged over tectoRNA scaffolds; values represent medians of the bootstrapped distributions, and error bars represent 95% confidence interval (CI). The specific mutations in each variant are shown in the tables underneath the bar chart, where blue squares represent the original 11ntR sequence and red/orange squares represent mutated sequences toward the IC3R/Vc2R, respectively. Lighter-colored bars represent lower limits for the ΔΔG measurements since the limit of detection (dashed horizontal line) lies within their CIs. (E,F) The mutational effect of each mutation (ΔΔGmut, measured as ΔΔG from the previous mutational intermediate) along the 11ntR → IC3R conversions (E, red) or 11ntR → Vc2R conversions (F, orange); values represent medians of the bootstrapped distributions, and error bars represent 95% CI (or limits to the CI). The x-axis is grouped by the order in which the mutation is made, e.g., first corresponds to a ΔΔG of a single mutant from the wt 11ntR. Gray bars correspond to upper or lower limits to ΔΔGmut values (negative or positive values, respectively), and each gray “x” refers to mutations for which neither quantitative nor qualitative ΔΔGmut values could be determined.
The conversion landscape from the 11ntR to the Vc2R differs substantially from the conversion pathway to the IC3R described above, as it includes energetically diverse pathways that together define a much less uniform landscape than that for IC3R (Fig. 3A, orange). The conversion requires five mutations, leading to 120 possible mutational pathways (Fig. 2A,B). The energetic signatures of these pathways vary, as evidenced by different mutational intermediates representing the highest energy point (Fig. 3B, orange). This variation contrasts with the regular behavior for the IC3R conversion, in which all pathways have the penultimate (third) step as highest (or equivalent to highest) in energy (Fig. 3B,C, red). Despite the differences in the pathways to the VC2R, the final step in each pathway results in stronger binding regardless of the actual mutation made, even for the otherwise highly deleterious A8U mutation (Fig. 3D,F). The increase in binding at the last step––and the different effects of the same mutation at different steps––indicate the cooperative formation of interactions for the Vc2R that enhance TL binding (Fig. 3F), as we also observed for IC3R in the final mutational step (Fig. 3E).
The more featured topography of the 11ntR → Vc2R sequence-energy landscape results from one mutation, A8U, which is much more deleterious than the other mutations when introduced at the first, second, or third step (Fig. 3D,F). The distinct energetic effect from mutating residue A8 in the 11ntR presumably arises because it directly hydrogen bonds with 2TLA in the GAAA (2TLA H-bonding, Fig. 1D). As a result, its removal gives a larger energetic effect than the removal of residues that align and aid its interaction but do not directly interact with the TL. The role of residue 8 changes in the IC3R and Vc2R (vs. the 11ntR) and is purported to be the same in both—making a WC pair with residue 3 or 4, respectively (Fig. 1B,C). Conversion from the 11ntR to Vc2R requires mutation of A8, eliminating its interaction with 2TLA before the TLR can adopt the 8 • 4 base-pairing architecture (Fig. 1B). In contrast, the retention of A8 in the conversion to IC3R allows it to continue to contribute to binding until too many of the peripheral residues are mutated to support its interaction with 2TLA. The very different conversion landscapes for IC3R and Vc2R therefore is not a consequence of different physical interactions or different cooperative networks within the final TLRs but rather results from differences in the intermediate species that must be traversed to arrive at each TLR.
Returning to the 11ntR → IC3R landscape, the remarkable smoothness of the pathways might suggest that there are cases where energy landscapes can be modeled as a simple function of sequence space—e.g., Levenshtein distance (Berger et al. 2021)—without considering molecular features. However, two observations indicate that this simplicity is not an intrinsic property of the sequences underlying the 11ntR → IC3R conversion. The first involves the effect of K+ which binds to the 11ntR and strengthens its interaction with the GAAA TL (Basu et al. 1998; Davis et al. 2007; Lambert et al. 2009; Bonilla et al. 2021; Shin et al. 2023). While one might expect a simpler landscape upon exclusion of K+, the energetic effects of specific mutations instead become more idiosyncratic as residues that had contributed to K+ binding no longer do so (Supplemental Fig. S8A). The second involves binding to a GUAA TL (instead of a GAAA TL), which removes interactions with the 2TLA (Bonilla et al. 2021) and results in a more featured landscape (Supplemental Fig. S8B). Most TLR intermediates bind weakly to the GUAA TL, but some bind with similar or greater affinity than wt 11ntR, IC3R, or Vc2R. These strongly binding intermediates result in isolated free energy wells, characteristic of a rugged landscape.
Conversion pathways on TLR sequence-conformation landscapes
TL • TLR interactions stabilize structured RNAs and help specify their conformational state(s). In the previous section, we described changes in the stability of the tertiary interaction as a function of TL • TLR sequence—i.e., the TLR sequence-energy landscape. In this section, we investigated the effects of TLR sequence on the preferred conformation of the TL • TLR interaction (the sequence-conformation landscape). Here, conformation refers to the distance between and orientations of the helices emanating from the TL and TLR, since the formation of the TL • TLR interaction requires these helices in the host RNA molecule to adopt a binding-proficient alignment (Fig. 4A). Prior results indicate that the conformational preferences of the IC3R and Vc2R differ from those of the 11ntR (Bonilla et al. 2021). We explored the conformational preferences along the pathways converting the 11ntR to the IC3R or Vc2R, asking where along the pathways the conformational preferences change and where they adopt the preferences of the TLR end points.
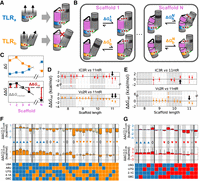
Thermodynamic fingerprints provide information about the sequence-conformation landscape. (A) Schematic of how differences in TL • TLR-binding geometry and scaffold geometry lead to conformational penalties in a tectoRNA.
Two TLRs (a, blue; b, orange) bind to the TL (green) in two orientations. Helical segments are denoted by cylinders and loops/bulges
by solid lines connecting them; tertiary contacts are depicted as dashed red lines. The binding of TLRa (blue) aligns the orthogonal TL • TLR pair (black) for binding, whereas binding of TLRb (orange) puts the tectoRNA in a conformation that does not favor the orthogonal TL • TLR. (B) Different scaffold geometries can induce tectoRNA conformation changes during binding. The TL • TLRs in (A) are placed into two example tectoRNA scaffolds, one with a straight helix (Scaffold 1) and one with a bulge (Scaffold N).
When the geometries of the scaffold and TL • TLR align, tectoRNA interaction is stronger ( <
<  ); when they do not align, the tectoRNA must change its conformation, resulting in unfavorable binding (
 >
>  ). (C) Comparison of thermodynamic fingerprints for two TLRs with different binding geometries. The ΔG values (top) across different scaffolds make up their respective thermodynamic fingerprints. ΔΔGrel values (red) are used to compare the thermodynamic fingerprints of different TLR sequences. They are obtained from comparing
the ΔΔG between the two sets of ΔG values (bottom) to the median ΔΔG value (gray). (D,E) Comparisons of the thermodynamic fingerprints of the 11ntR with the IC3R (red) and Vc2R (orange) binding to a (D) GAAA or (E) GUAA TL. Median and 95% CIs of ΔΔGrel are depicted across the 20 scaffolds. Scaffolds that induce a significantly different binding conformation (ΔΔGrel ≠ 0) are denoted by black arrows. (F) The
). (C) Comparison of thermodynamic fingerprints for two TLRs with different binding geometries. The ΔG values (top) across different scaffolds make up their respective thermodynamic fingerprints. ΔΔGrel values (red) are used to compare the thermodynamic fingerprints of different TLR sequences. They are obtained from comparing
the ΔΔG between the two sets of ΔG values (bottom) to the median ΔΔG value (gray). (D,E) Comparisons of the thermodynamic fingerprints of the 11ntR with the IC3R (red) and Vc2R (orange) binding to a (D) GAAA or (E) GUAA TL. Median and 95% CIs of ΔΔGrel are depicted across the 20 scaffolds. Scaffolds that induce a significantly different binding conformation (ΔΔGrel ≠ 0) are denoted by black arrows. (F) The  values compared against the 11ntR (top) or IC3R (bottom) for all 11ntR → IC3R variants. Median and 95% CIs for
  are plotted. Red triangles represent variants with significant differences from the 11ntR; blue triangles represent variants
with significant differences from the IC3R; white diamonds represent variants with significant differences from both. (G) The
are plotted. Red triangles represent variants with significant differences from the 11ntR; blue triangles represent variants
with significant differences from the IC3R; white diamonds represent variants with significant differences from both. (G) The  values compared against the 11ntR (top) or Vc2R (bottom) for all 11ntR → Vc2R variants. Median and 95% CIs for
  are plotted. Orange, blue, and white symbols represent variants with significant differences from the 11ntR, Vc2R, or both,
respectively.
are plotted. Orange, blue, and white symbols represent variants with significant differences from the 11ntR, Vc2R, or both,
respectively.
The tectoRNA system allows us to compare the conformational preferences of TLRs by varying the scaffold in the chip piece hairpin, shortening/elongating the helix, changing the helical sequence, and/or adding mismatches or internal bulges (Fig 2C, pink, Supplemental Fig. S3; Jaeger et al. 2001; Denny et al. 2018; Yesselman et al. 2019a; Bonilla et al. 2021; Shin et al. 2023). These different scaffolds require conformational adjustments in the tectoRNA to allow the two TL • TLR contacts to form above and below the scaffold (Fig. 4B). As a result, the affinity (ΔGbind) for each scaffold depends on the energetic cost of adopting distorted, nonoptimal tectoRNA conformations (Bonilla et al. 2017, 2021; Bisaria et al. 2017; Shin et al. 2023). The set of ΔGbind values for a given tertiary interaction as a function of scaffold sequence defines a “thermodynamic fingerprint” for that interaction (Fig. 4C, top; Denny et al. 2018; Bonilla et al. 2021; Shin et al. 2023). If two TL • TLRs have the same geometric preferences, then they will have identical fingerprints; different fingerprints indicate that the two motifs differ in their binding geometries. To compare the geometric preferences of different TLRs, we calculate ΔΔG values for each scaffold to assess where fingerprints differ (Fig. 4C, bottom). Since each TLR binds the TL with different intrinsic binding strengths, we compare the fingerprints after subtracting the median ΔΔG across the scaffolds for each TLR (ΔΔGrel; Fig. 4C, red arrows). We note that identical fingerprints do not indicate that there are no differences, rather that there are no significant differences in the regions of conformational space explored by the scaffold sequences studied herein.
The thermodynamic fingerprints for the wt TLRs recapitulate previously described conformational differences between the 11ntR and the IC3R or Vc2R (Bonilla et al. 2021). The longer 11 bp scaffolds generally decrease GAAA binding for the 11ntR more than either the IC3R or Vc2R (Fig. 4D, ΔΔGrel < 0, Supplemental Fig. S9A). This differential effect is decreased or abrogated when binding to the GUAA TL, suggesting that the 11ntR interaction with the 2TLA that is not present for IC3R or Vc2R is responsible for the different thermodynamic fingerprints and the more narrow fingerprint for the 11ntR than for the IC3R or Vc2R (Fig. 4E; Supplemental Fig. S9B; Bonilla et al. 2021).
As 2TLA makes hydrogen bonds to A8 of the 11ntR but not in the Vc2R or IC3R (Fig. 1), we might expect different conformational landscapes for conversion from the 11ntR to the IC3R versus the Vc2R based on whether A8 is mutated, as we saw for the energetic landscapes. To test this model and more broadly investigate
the conformational landscape, we compared the thermodynamic fingerprints of intermediate TLRs to their pathway end points.
In particular, we used the ΔΔGrel values for Scaffold 11.3 ( ,
,  , or
, or  for comparisons to the 11ntR, IC3R, or Vc2R, respectively) as a metric for changes to conformational preferences as it had
the most significant difference for the wt receptors (Fig. 4D, black arrows)
for comparisons to the 11ntR, IC3R, or Vc2R, respectively) as a metric for changes to conformational preferences as it had
the most significant difference for the wt receptors (Fig. 4D, black arrows)
The A8U mutation gives a fingerprint closer to the Vc2R than the 11ntR, as predicted, and most subsequent intermediates along
the 11ntR → Vc2R pathways containing A8U maintain a Vc2R-like fingerprint (8 of the 10 sequences with quantitative  , Fig. 4F). However, one subsequent mutation, G6C, restores the 11ntR conformational preference despite the mutation of A8 (
 ∼ 0 for A8U/G6C). Residues 6 and 8 are not expected to interact within the receptor, so the nonindependent conformational
effects may arise indirectly via other interactions within the motif.
∼ 0 for A8U/G6C). Residues 6 and 8 are not expected to interact within the receptor, so the nonindependent conformational
effects may arise indirectly via other interactions within the motif.
The other deviating mutant, A8U/G6C/4.1A/U7G, results in a fingerprint that differs from both the 11ntR and Vc2R, indicating that the 11ntR → Vc2R conversion landscape contains potential branching points to alternative TLRs with different binding conformations (Fig. 4F; Supplemental Fig. S10B). A distinct fingerprint is also seen for the U9A/U7G/G6C triple mutant (Fig. 4F; Supplemental Fig. S10B). These two intermediates were not outliers in the energetic landscapes, indicating that the conformational and energetic properties of TLR sequences need not track together across sequence space.
The energy and conformational landscapes for the 11ntR → IC3R conversion also differ, even though it does not involve a direct disruption to the A8 • 2TLA interaction (Fig. 4G). In particular, the 2.1C insertion is associated with a non-11ntR fingerprint (Fig. 4G; Supplemental Fig. S10A), consistent with the insertion disrupting the interactions between 2C and 3U in the 11ntR with the TL (Fig. 1A,D).
Overall, the sequence-conformation landscapes spanning the conversions between these TLR are complex. Sampling different TLR conformational preferences across sequence space can result in context-dependent energetic penalties and, presumably, additional complexities in adaptive fitness landscapes.
TL • TLR fitness-stability relationships depend on their RNA hosts
We previously observed that the number of 11ntR sequence variants found in natural RNAs correlates with the stability of its interaction with the TL (Bonilla et al. 2021). This relationship is consistent with a model in which TL • TLR stability is a major driving force for 11ntR selection (Fig. 5A). A strong correlation remains when we include all known natural TLR variants (Fig. 5B). Nevertheless, several sequences occur with much higher frequencies than expected from the correlation, including the IC3R (red point, Fig. 5B). This overrepresentation of the weaker-binding IC3R in natural RNAs introduces the possibility of positive selection for this TLR (and potentially others) based on properties other than tertiary contact stability.
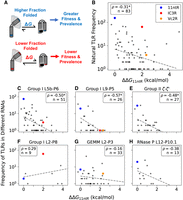
Frequency-stability relationships for natural TLRs. (A) A more stable tertiary interaction could lead to a higher fraction folded of the host RNA, in turn leading to greater fitness and prevalence in biology. (B) The (log) frequency of TLR variants across different host RNAs has a (significantly) negative correlation with the stability of the RNA. (C–H) The frequency-stability correlation is stronger in some host RNA contexts and nonexistent in others. Stability is represented as the average ΔΔG from the 11ntR in 30 mM Mg2+ taken from Bonilla et al. (2021). The three TLRs highlighted in this work are denoted by colored points: blue for the 11ntR, red for the IC3R, and orange for Vc2R. Dashed gray lines plot the log-linear fit between frequency and stability. Significant negative correlations are signified with an asterisk.
To investigate whether TLRs in different RNA contexts might be subject to different selective pressures, we plotted TL • TLR frequency-stability relationships for each of the six RNA locations in which natural TLR variants have been found (Fig. 5B–G). Three of the six maintain the above-noted correlation between frequency and stability, with statistically significant Pearson correlation coefficients of ∼–0.5 (Fig 5C–E, Group I L5b-P6, Group I L9-P5, and Group II ζ-ζ′). In contrast, two do not have significant correlations (Fig. 5F,G, Group I L2-P8, GEMM L2-P3), and one (RNase P L12-P10.1, Fig. 5H) has too few points and/or too much variation to be statistically significant.
The IC3R is the most represented TLR in the Group I L2-P8 contact (Fig. 5F, red), suggesting that this structural context may select for properties other than the higher stability given by the 11ntR. Given that the IC3R favors different binding conformations than that of the 11ntR, we posit that the L2-P8 contact may require a more IC3R-like geometry leading to its predominance over the 11ntR. Nevertheless, the Vc2R, which has a similar binding conformation to the IC3R, is absent from annotated Group I L2-P8 contacts, underscoring the possibility of additional selective features as well as limitations from the small number of and biases in the represented sequences from the evolutionary history of these RNAs. Future bioinformatic and structural studies of these RNAs may allow further tests of these models of TLR fitness.
The TLR sequence frequency in the L2-P3 contact of the GEMM riboswitch also does not significantly correlate with stability (Fig. 5G). The need for riboswitches to change structure upon ligand binding may favor TL • TLRs of intermediate strength––strong enough to form but weak enough to be disrupted upon ligand binding (Sudarsan et al. 2008; Smith et al. 2009). Nevertheless, a range of stabilities are present in the GEMM riboswitch TL • TLRs, including tightly binding variants. It will be fascinating to determine if evolution has tuned the stabilities of riboswitches and other RNAs (including the ribosome and spliceosome) to allow the formation of and transition between multiple states and to what extent this tuning differs in different cellular environments.
DISCUSSION
Evolutionary models often, by necessity, assume simplified adaptive landscapes. Nevertheless, we found that the energy and conformational landscapes spanning the parsimonious conversion pathways from the 11ntR to the IC3R or Vc2R are highly dependent on the intermediate sequences traversed, even for a case where the properties of the end points (IC3R and Vc2R) are similar. Comprehensive energetic and conformational data combined with existing structural models provided explanations for at least some of these behavioral differences. Quantitative multidimensional information about these RNA elements––their stabilities and conformational preferences––also allowed us to test models for their selection and to provide evidence for the dominance of different selective pressures for the same RNA motifs in different RNA host molecules.
The high-throughput thermodynamic data predict changes to the conformational ensembles of RNA molecules containing different TL • TLR interactions but do not report directly on the structural changes that lead to these different conformations. It remains a future challenge to develop methods to quantitatively probe and report on the structural ensemble of the bound state and to formulate predictive models linking these structural changes to the energetic effects uncovered by the “thermodynamic fingerprint” analysis.
Investigating how the biophysical properties of RNA motifs vary across sequence space is critical for understanding the function and evolution of motifs and their host RNAs. We focused on three naturally occurring TLR motifs in this work, but our systematic quantitative approach is readily adapted to other RNAs. We suggest that this approach will be necessary to establish biochemical understanding, as the biochemical functions of RNAs are enabled by the combined biophysical properties of their elements. Biological understanding can also be revealed from the underlying energetic and conformational landscapes of RNA, which may provide insights into selective driving forces and additional context-dependent constraints. For example, parallel systematic approaches in vitro and in vivo may help dissect the interplay of kinetic and thermodynamic factors for riboswitch regulation in cells and for other functional RNAs.
MATERIALS AND METHODS
RNA array data collection
Equilibrium constants for the TLR • TL interactions were derived from fluorescent binding experiments on a modified Illumina MiSeq flowcell as previously described (Buenrostro et al. 2014; She et al. 2017; Denny et al. 2018). In short, a DNA library consisting of the tectoRNA “chip piece” sequences were sequenced on an Illumina MiSeq v3 150-cycle kit (Illumina). The flowcell was then transferred to a modified Genome Analyzer IIx (Illumina) with temperature control, whereupon dsDNA was transcribed using a biotinylated primer. Streptavidin was bound to the biotinylated dsDNA molecules on the flowcell, and RNA was transcribed by E. coli RNA polymerase. The streptavidin prevented runoff transcription, tethering the RNA transcripts to the flowcell surface. Fluorescently labeled “flow piece” RNA was titrated into the flowcell, and its binding to the chip piece transcripts was observed via total internal reflection fluorescent microscopy.
The normalized fluorescence data for molecular replicates (clusters) were resampled in a bootstrap procedure and fit to binding isotherms. We set a minimum number of five clusters per sequence variant to fit equilibrium constants. Four experimental conditions were assayed: TLRs binding to GAAA in 30 mM Mg2+ and 30 mM Mg2+ + 150 mM K+; TLRs binding to GUAA in 30 mM Mg2+ and 30 mM Mg2+ + 150 mM K+. Detailed materials and methods are available in the Supplemental Methods.
Sequence variants had an average of 41 and 24 clusters for binding to GAAA and GUAA in 30 mM Mg2+, and 43 and 43 clusters for binding GAAA and GUAA in 30 mM Mg2+ + 150 mM K+ (Supplemental Fig. S4). We identified experimental thresholds for binding based on the fit ΔGbind of negative controls in the library, which consist of RNA molecules lacking a TL. We set the cutoff as the 99th percentile of the ΔGbind distribution, which differed across experiments (Supplemental Fig. S5). The ΔGbind values for TLR variants were clipped at the cutoff, which should be understood as a lower limit for binding under the respective experimental conditions. The cutoffs were found to be –6.9 kcal/mol and –7.1 kcal/mol for binding to GAAA or GUAA in 30 mM Mg2+, and –7.0 kcal/mol and –6.8 kcal/mol for binding to GAAA or GUAA in 30 mM Mg2+ + 150 mM K+.
Two experiments were performed to measure binding of 11ntR variants to the GAAA tetraloop in 30 mM Mg2+, and the replicate data correlated well with a correlation coefficient of 0.94 among nonlimit measurements (Supplemental Fig. S6). The resulting ΔGbind distributions were combined by taking the average of the two ΔGbind values from each bootstrap (n = 10,000) distribution:

Statistical analysis
We leveraged the empirical distributions of ΔGbind obtained via bootstrapping to directly propagate uncertainty throughout our calculations. ΔΔG values, the difference between variant and wt binding, were calculated by subtracting the wt ΔGbind value from the mutant ΔGbind value for each scaffold. Reported ΔGbind and ΔΔG values represent the median and 95% CI from the distribution of the average over a subset of nine scaffold sequences, which were chosen to maximize quantitative (i.e., nonlimit) values while omitting scaffolds that induce significantly different conformational penalties (e.g., Scaffolds 11.3 and 11.4, see “Conversion pathways on TLR sequence-conformation landscapes” section).
Thermodynamic fingerprints
We assessed whether the thermodynamic fingerprints of two TLRs differ, as follows. First, we isolated the conformational effect
from the binding energy by determining an offset between the ΔG values for the TLRs. The following expression was used to calculate this offset:
 where FTLR i is a vector that contains the thermodynamic fingerprint for TLR i (the ΔG values for all 20 scaffolds) and || · ||1 is the L1 norm, which we chose due to its resilience to outliers (i.e., scaffolds that result in big differences in binding will affect
the offset less). From the properties of the L1 norm, we know that the above equation reduces to:
where FTLR i is a vector that contains the thermodynamic fingerprint for TLR i (the ΔG values for all 20 scaffolds) and || · ||1 is the L1 norm, which we chose due to its resilience to outliers (i.e., scaffolds that result in big differences in binding will affect
the offset less). From the properties of the L1 norm, we know that the above equation reduces to:
 With this offset, we then calculated the ΔΔGrel for a TLR compared to a reference TLR:
 where ΔΔGrel represents a vector holding the ΔΔGrel value for all 20 scaffolds. We then calculated each (one-sided) P-value testing for a significantly nonzero ΔΔGrel value:
 where the superscript s represents a calculation for a particular scaffold, FTLR is the fingerprint of the TLR of interest, and FTLR,ref is fingerprint of the reference TLR to which the comparison is made.
The resulting P-values were corrected for multiple hypothesis testing using the Benjamini–Hochberg false discovery rate correction (Benjamini and Hochberg 1995) for each of the 11ntR → IC3R and 11ntR → Vc2R sequence-conformation landscapes. Significance was assigned if the adjusted P-value was less than 0.05.
Frequency versus stability fits
Frequency and stability data for 83 naturally occurring TLR variants were obtained from previously published results (Bonilla et al. 2021). As discussed in the section “TL • TLR fitness-stability relationships depend on their RNA hosts,” we found an empirical
log-linear relationship between the relative frequency of a TLR in a given structural context and its relative free energy:
 To test this relationship across different RNA host contexts, we calculated the Pearson correlation coefficient between the
log frequency and the ΔΔG11ntR for every TLR found in a particular host context. The frequency and ΔΔG11ntR values were resampled n = 10,000 times to generate a bootstrapped distribution for the Pearson correlation coefficient. Structural contexts in which
the 95% CI for the correlation coefficient did not contain 0 were deemed to have a significant correlation; otherwise, no
significant correlation was noted.
To test this relationship across different RNA host contexts, we calculated the Pearson correlation coefficient between the
log frequency and the ΔΔG11ntR for every TLR found in a particular host context. The frequency and ΔΔG11ntR values were resampled n = 10,000 times to generate a bootstrapped distribution for the Pearson correlation coefficient. Structural contexts in which
the 95% CI for the correlation coefficient did not contain 0 were deemed to have a significant correlation; otherwise, no
significant correlation was noted.
SUPPLEMENTAL MATERIAL
Supplemental material is available for this article.
ACKNOWLEDGMENTS
We thank members of the Herschlag laboratory for discussion and review of the manuscript. We would like to thank Fanny Sunden for her insights and guidance in designing and running experiments and Joe Yesselman for his computational and conceptual support and pedagogy during library development. This work was supported by the National Institutes of Health (R01 GM132899 to D.H. and H.A.). J.H.S. was supported by the National Science Foundation (NSF) Graduate Research Fellowship Program under Grant DGE-1656518. D.H. serves on the Scientific Advisory Board of Arrakis Therapeutics. Some of the computing for this project was performed on the Sherlock cluster. We would like to thank Stanford University and the Stanford Research Computing Center for providing computational resources that contributed to these research results. Molecular structures were visualized using PyMOL (Schrödinger, LLC.).
Footnotes
-
Article is online at http://www.rnajournal.org/cgi/doi/10.1261/rna.080039.124.
- Received May 28, 2024.
- Accepted September 18, 2024.
This article is distributed exclusively by the RNA Society for the first 12 months after the full-issue publication date (see http://rnajournal.cshlp.org/site/misc/terms.xhtml). After 12 months, it is available under a Creative Commons License (Attribution-NonCommercial 4.0 International), as described at http://creativecommons.org/licenses/by-nc/4.0/.
REFERENCES
MEET THE FIRST AUTHOR

Meet the First Author(s) is an editorial feature within RNA, in which the first author(s) of research-based papers in each issue have the opportunity to introduce themselves and their work to readers of RNA and the RNA research community. John Shin is the first author of this paper, “Exploring the energetic and conformational properties of the sequence space connecting naturally occurring RNA tetraloop receptor motifs.” John Shin is a graduate student in the chemical engineering department at Stanford University, working in Dr. Dan Herschlag's lab. His research involves utilizing quantitative, high-throughput assays to thermodynamically characterize RNA and RNA–protein structural motifs such as the focus of this article, the tetraloop receptor.
What are the major results described in your paper and how do they impact this branch of the field?
This work uncovers the complexities in the sequence-function landscapes of RNA motifs. We mapped out the properties of naturally occurring tetraloop receptor motifs and the mutational intermediates that span them, separately assessing their tertiary contact affinities and conformational preferences. These results indicate that the specific mutations and the order in which they are made drastically alter the sequence-feature landscapes of these motifs: The mutational effects are idiosyncratic and not readily parameterized by simple measures of mutational distance. Moreover, we find that these properties do not correspond one-to-one with fitness, suggesting that different RNA molecules can select for different properties of the same class of motif. Our systematic study of these RNA motifs provides a firm basis upon which we may build a quantitative and predictive understanding of the roles that they play in their hosts and their evolution.
What led you to study RNA or this aspect of RNA science?
I was captivated by the match between the modular nature of structured RNAs and the recent development of quantitative, high-throughput methods to study RNA and its interactions. With so much focus on “structure prediction,” I find that the underlying thermodynamics that govern the folding and assembly of RNA (and proteins!) are left understudied. I like to think of RNA as a puzzle: We have the various pieces (motifs such as tetraloop receptors), but we don't yet know how they fit together.
During the course of these experiments, were there any surprising results or particular difficulties that altered your thinking and subsequent focus?
We were surprised at just how different the sequence-energy landscapes were for the two sets of mutational pathways, notably how smooth the 11ntR to IC3R landscape is compared to the 11ntR to Vc2R. As we discuss in the paper, these landscapes are consistent with the molecular architecture of these tetraloop receptors, underscoring how important it is to think in terms of molecules and their interactions more so than abstract descriptions of the motifs.
What are some of the landmark moments that provoked your interest in science or your development as a scientist?
I was able to get experience in research as an undergraduate at UC Berkeley with Dr. Jay Keasling and Dr. Lisa Alvarez-Cohen, where I found an interest in pursuing academic research. Joining the Herschlag lab at Stanford has furthered my development as a scientist under the guidance of my fellow lab members and Dr. Herschlag.
If you were able to give one piece of advice to your younger self, what would that be?
I would advise myself to take advantage of my mentors more! Now that I've learned that scientists are just people too, I realize there's no need hesitate to reach out to people in my undergraduate labs to learn from their experiences.
Are there specific individuals or groups who have influenced your philosophy or approach to science?
My advisor, Dr. Herschlag, has influenced my philosophy of science. The incredible rigor with which he approaches science, from proposal to experiments to paper writing, and the emphasis on strong inference are qualities I hope to gain as a scientist.
What are your subsequent near- or long-term career plans?
I am working toward my PhD at Stanford and will continue studies of RNA (and RNP) motifs.




