


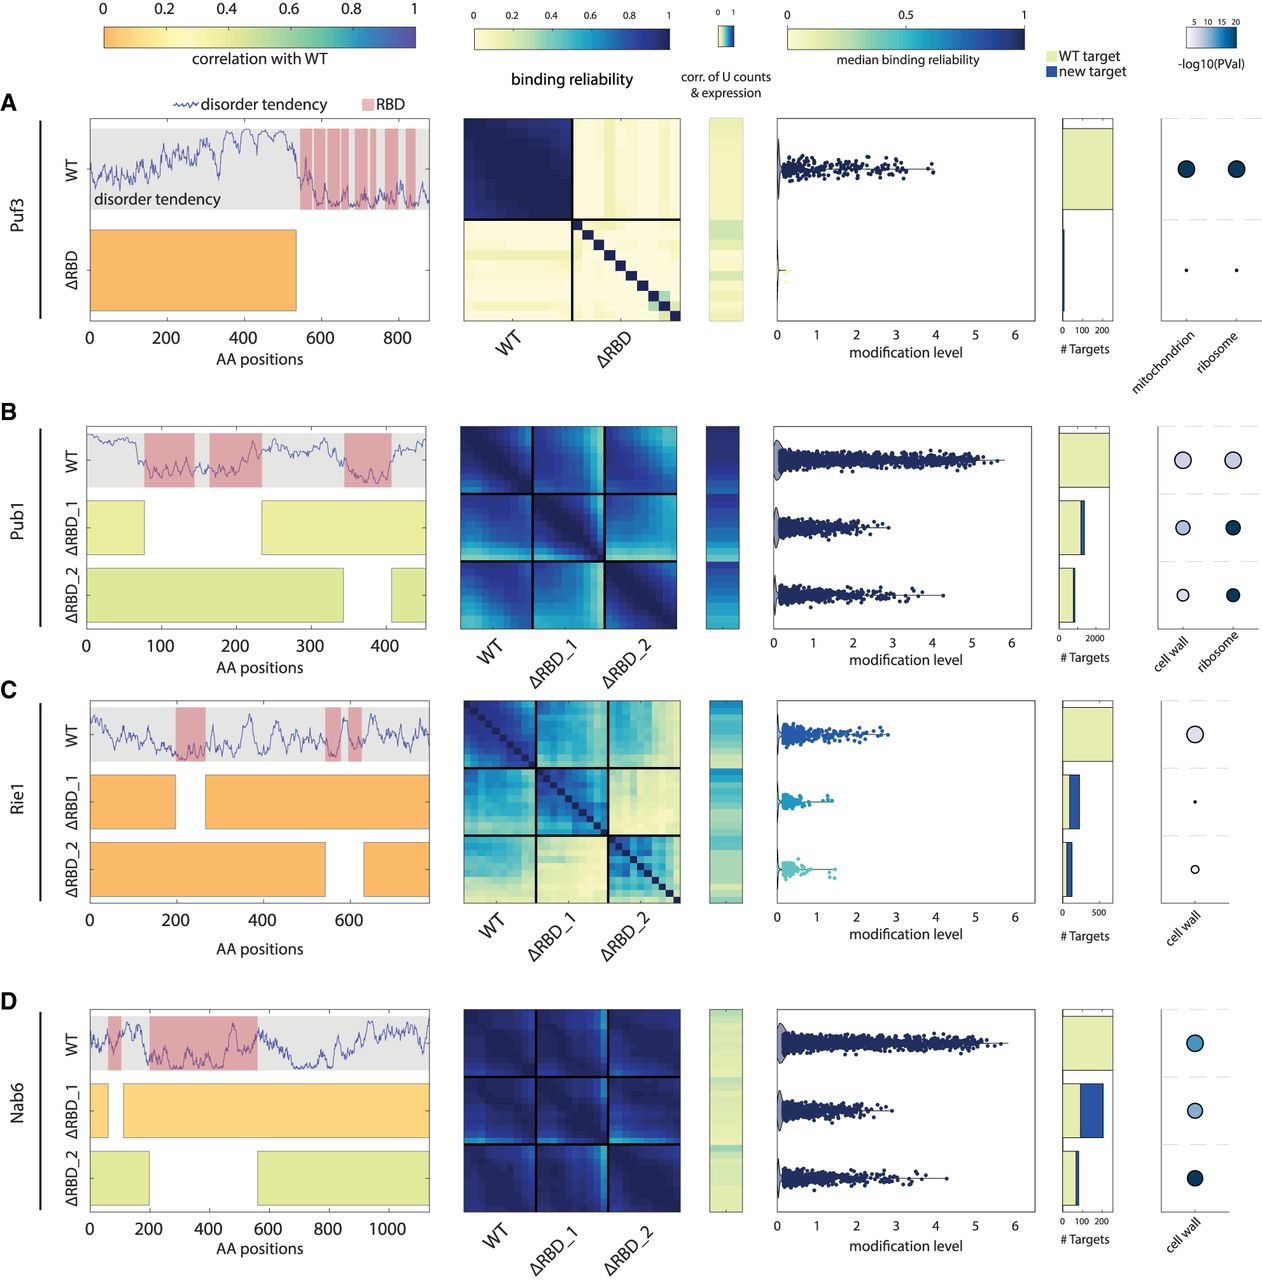
Differential contribution of RBDs to binding affinity and specificity. (A, left to right) Disorder tendency along the length of Puf3 with RBDs indicated in pink. Beneath, a representation of the residues kept in the RBD deletion strain; color indicates the correlation of the modification level in log2 between the mutant and WT strain. Heatmap of binding reliability for WT and RBD deletion strain (see Fig. 2B). Correlation of expression with U counts for U stretch length 4–13. Scatter showing the modification level of each target, color indicates median binding reliability. Bar graph of the number of targets classified into old or new with respect to WT targets. GO-term enrichment of WT and mutant targets (as in Fig. 3F). (B–D) As in (A) for Pub1, Rie1, and Nab6. See Supplemental Figure S5A–D for Scp160, Puf4, Puf5, and Mrn1.




