


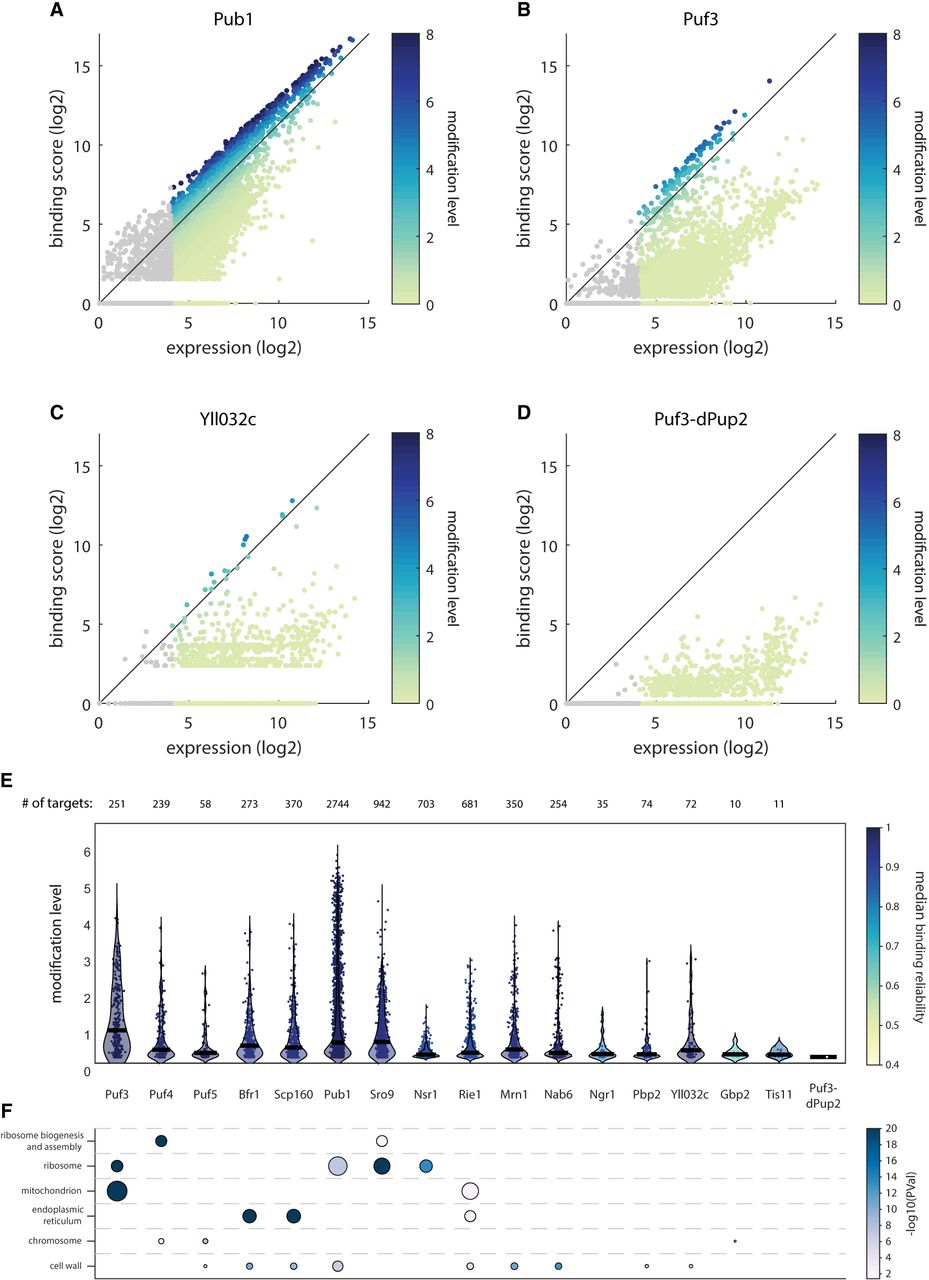
Binding profiles of RBPs provide new insights into their function. (A–D) Binding score as a function of expression (log2) for all genes in Pub1 (A), Puf3 (B), Yll032c (C), and Puf3-dPup2 (D). Color represents modification level (binding score to expression ratio; see Materials and Methods). (E) Distribution of modification level of targets of indicated mRBPs and Puf3-dPup2 control. Transcripts with a modification level higher than 0.15 were defined as targets. The number of targets for each RBP is indicated on top. Color represents the median binding reliability. (F) Significantly enriched (pVal < 0.05) GO groups among targets for mRBPs and Puf3-dPup2 control. Color and size indicate P-value and the number of targets in the GO-term, respectively.




