


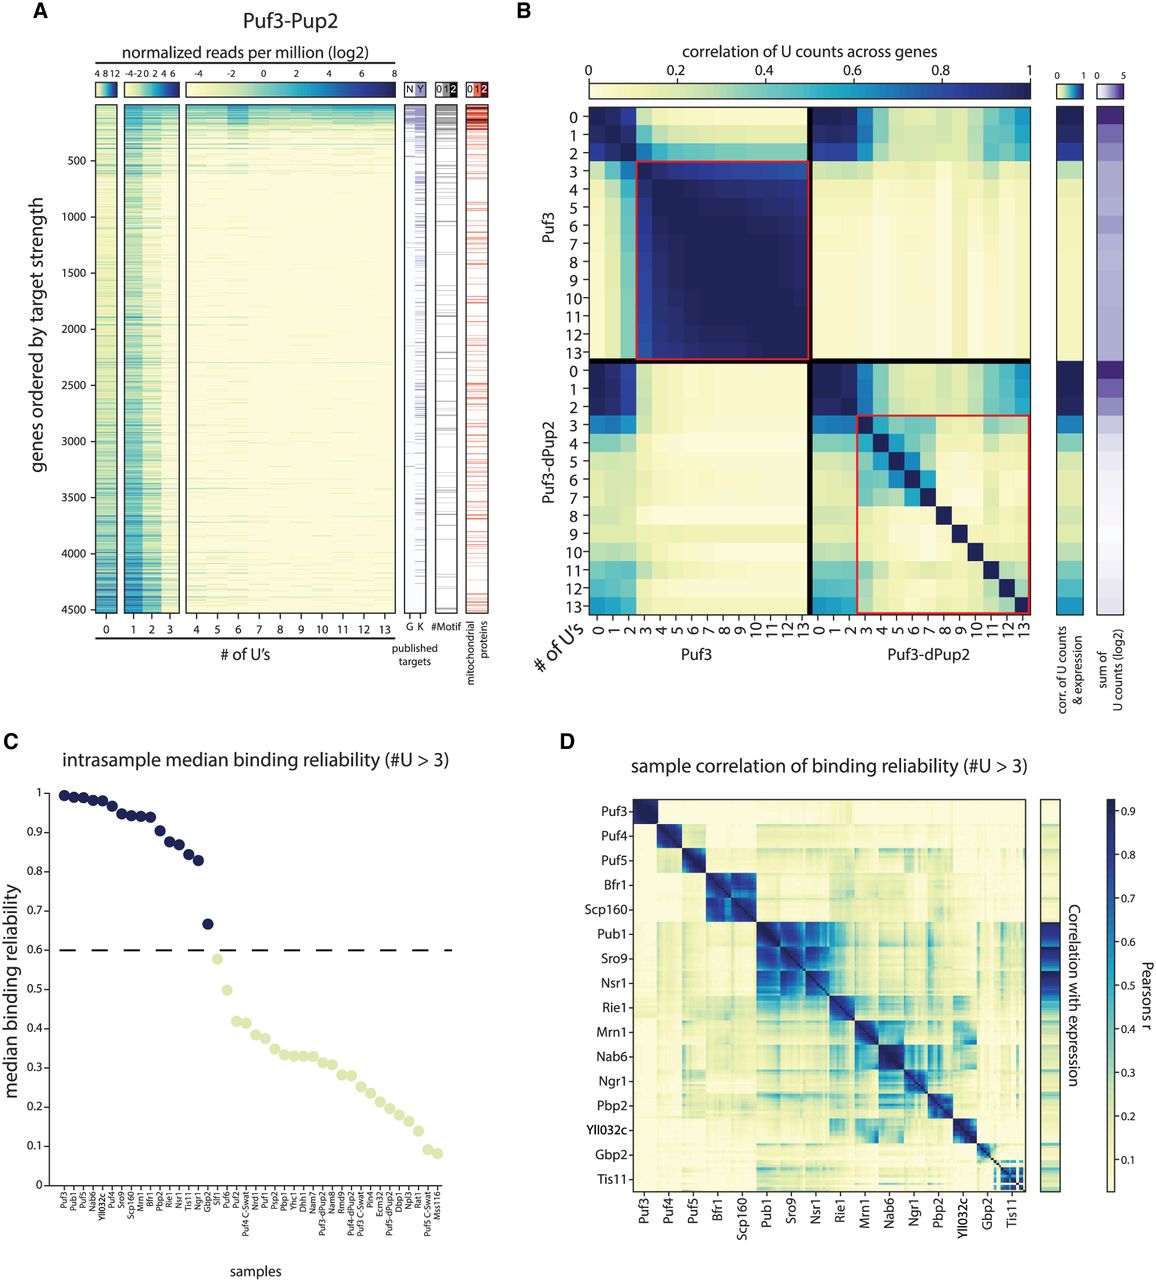
Mapping mRBP-binding profiles using the RNA-tagging method. (A, left) U-count matrix for Puf3-Pup2 strain, transcripts (rows) are ordered according to their modification level in log2 (binding score to expression ratio; see Materials and Methods). Color indicates the number of transcripts per million in log2 with the indicated number of Us (columns). (Right) Puf3 targets according to two separate publications (G, K) (Gerber et al. 2004; Kershaw et al. 2015), motif occurrences within the 3′ end, and mitochondrial GO. (B, left to right) Pairwise Pearson correlation of U counts across genes between U stretches of length 0–13 for Puf3-Pup2 and Puf3-dPup2 strains; correlation of U counts for indicated U stretch lengths with expression level in each strain (see Materials and Methods), sum of U counts across all genes for indicated U stretch lengths (0–13, log2). Marked in red: correlation of U counts for U stretches of length 4–13 across genes between themselves used to determine binding reliability (see Materials and Methods). (C) Median binding reliability (see Materials and Methods) for all mRBPs tested and dPup2 or nontagged (C-Swat) controls. Color indicates those mRBPs above the reliability threshold indicated by dotted line. (D) Pairwise Pearson correlation of U counts across genes between U stretches of length 4–13 (binding reliability), and correlation of U counts with expression for all strains with a median binding reliability above the threshold indicated in C.




