


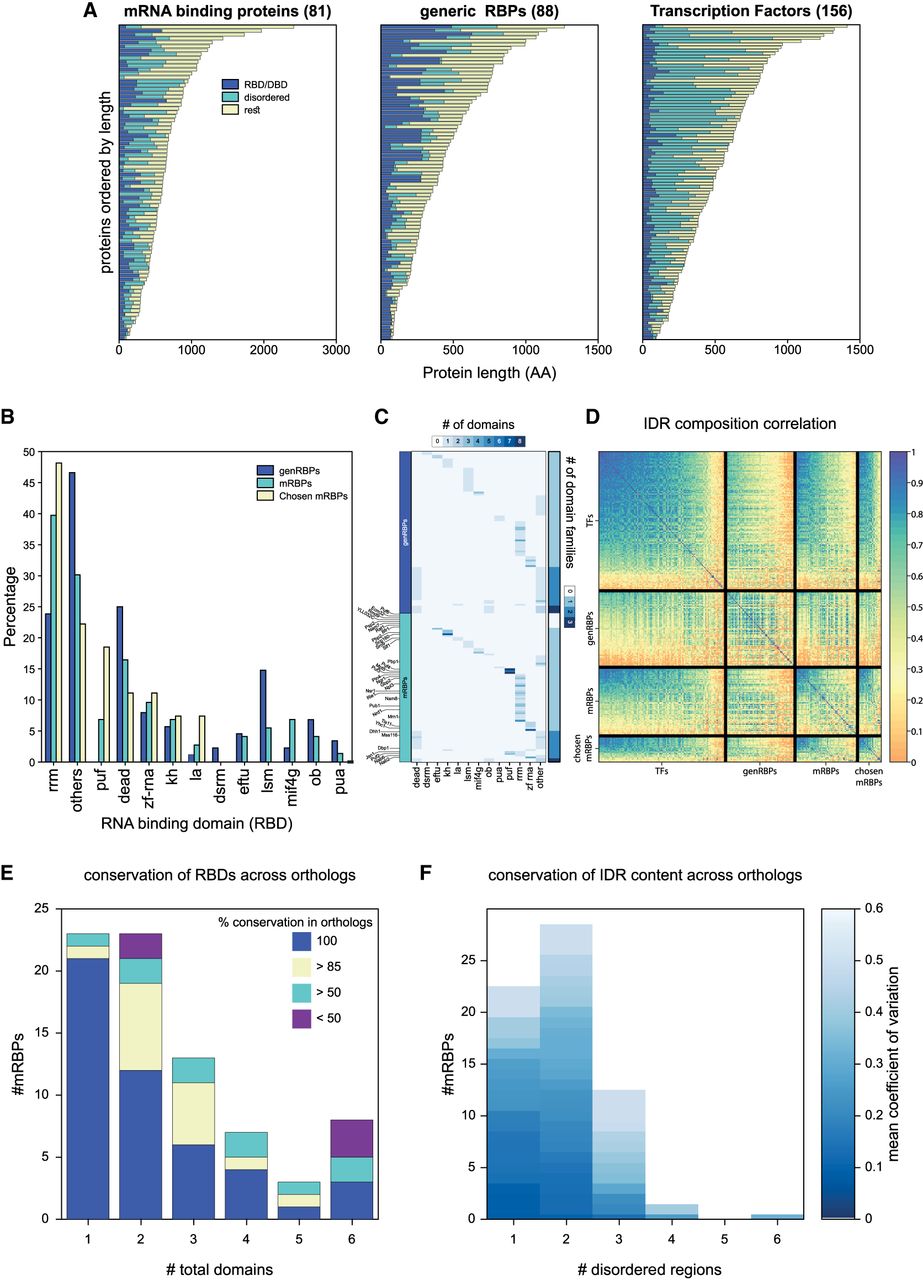
Predicted RBDs and IDRs occupy a large fraction of the mRBP sequences and are conserved throughout evolution. (A) Number of residues in RNA- or DNA-binding domains (RBD/DBD), disordered regions and the rest of the protein for mRBPs, genRBPs, and TFs. Proteins are ordered according to length in amino acids (AA). (B) Bar graph showing the percentage of genRBPs, mRBPs and chosen mRBPs containing the 12 indicated common RBDs or “others.” (C) Heatmap showing the type of RBDs (columns) in each of the genRBPs and mRBPs (rows); color indicates the number of domains. Right panel indicates the number of different domain families each RBP has. Names of the mRBPs chosen for experimental analysis are shown. (D) Pairwise correlation of AA composition between TFs, genRBPs, mRBPs, and chosen mRBPs. Of note, mRBPs also contain the chosen mRBPs. (E) Bar graph showing the number of mRBPs with 1–6 (or more) RBDs classified by the conservation of their RBD organization across all orthologs (i.e., type, number, and relative position). (F) Bar graph showing the number of the different mRBPs with 1–6 or more disordered regions. Color indicates the mean variation coefficient across the IDR regions of all orthologs.




