


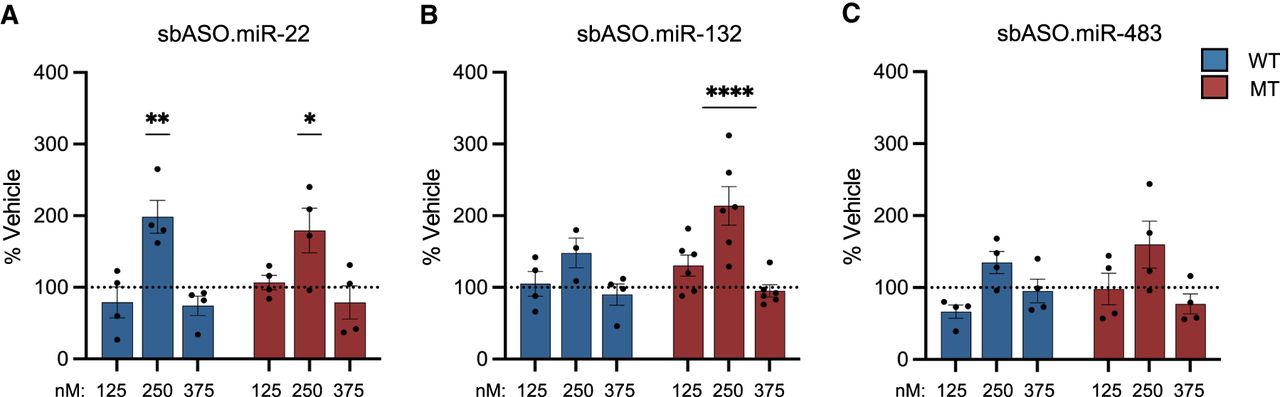
sbASOs increase total BDNF levels in MECP2-T158M NSCs. (A–C) ELISA experiments using isolated cytoplasmic extracts from WT and mutant T158M NSCs revealed a significant increase in BDNF levels in mutant NSCs at the 250 nM concentration for sbASO.miR22 and sbASO.miR-132 compared to sbASO scramble controls. (A) ELISA analysis of MT and WT NSCs treated with sbASO.miR-22 demonstrated that concentration had a significant impact on BDNF levels (two-way ANOVA F(3, 24) = 12.67, [****] P < 0.0001). A Tukey's multiple comparisons test indicated an increase at the 250 nM concentration, with a notable rise in BDNF levels in WT NSCs ([*] P = 0.0331) and an even more pronounced increase in mutant NSCs ([**] P = 0.0097). Other concentrations showed no changes in WT (125 nM, P = 0.8172; 375 nM, P = 0.7082) or MT (125 nM, P = 0.9907; 375 nM, P = 0.7868) NSCs. (B) Treatment with sbASO.miR-132 showed that concentration significantly influenced BDNF levels (two-way ANOVA F(3, 29) = 10.62, [****] P < 0.0001). A Tukey's multiple comparisons test revealed no differences in WT NSCs at any concentration (125 nM, P = 0.9956; 250 nM, P = 0.1968; 375 nM, P = 0.9673), but there was a substantial increase in mutant NSCs at the 250 nM concentration (125 nM, P = 0.3801; 250 nM [***] P = 0.0002; 375 nM, P = 0.9938). (C) MT and WT NSCs treated with sbASO.miR-483 showed that concentration had a measurable effect on BDNF levels (two-way ANOVA F(3, 24) = 5.031, [**] P = 0.0076). A Tukey's multiple comparisons test showed no changes in BDNF levels in either WT (125 nM, P = 0.3424; 250 nM, P = 0.3058; 375 nM, P = 0.9949) or mutant (125 nM, P = 0.9995; 250 nM, P = 0.4183; 375 nM, P = 0.6196) NSCs at any concentration compared to sbASO scramble controls. Data are presented as mean ± SEM. Statistical significance is indicated as (*) P < 0.05, (**) P < 0.01, (***) P < 0.001, (****) P < 0.0001.




