


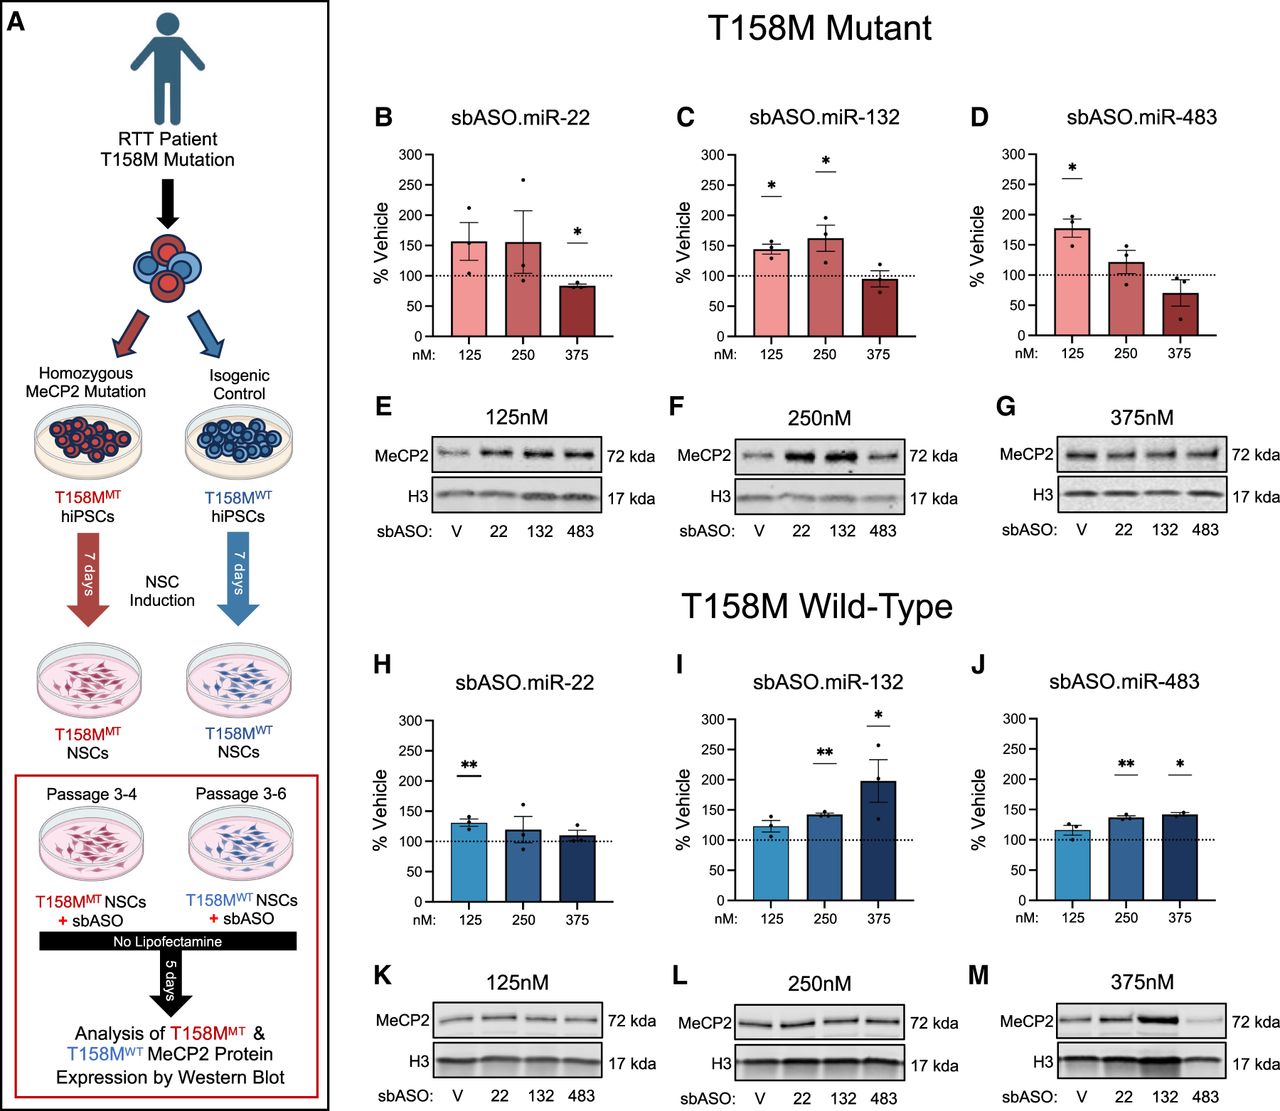
sbASO show efficacy in MECP2-T158M NSCs. (A) Schematic representation of NSC(s) differentiation from iPSCs and the experimental strategy to evaluate the effect of sbASOs on NSCs. (B–D, H–J) Western blot analysis of MeCP2 protein levels in the nuclear fraction of T158MMT and T158MWT NSCs. Protein quantification was normalized using Histone H3 (H3), with data represented as the mean percentage relative to vehicle treatment. The sbASOs effectively increased MeCP2 expression in both mutant (MT) and WT NSCs at various concentrations. Representative western blots show relative MeCP2 protein quantities in MT and WT NSCs treated with sbASOs at concentrations of 125 nM (E,K), 250 nM (F,L), and 375 nM (G,M). (Upper band) MeCP2 (71 kDa), (lower band) H3 (17 kDa). The analysis includes n = 3 replicates for each condition and sbASO, illustrating the relative expression levels of MeCP2 in response to the different sbASO concentrations. Outliers were removed by Grubb's tests at α = 0.1. Data presented as mean ± SEM. (B–H) Compared to scramble sbASO controls, (B) MT NSCs showed no difference in MeCP2 protein levels when treated with sbASO.miR-22 at 125 nM [t (df,4) = 1.816, P = 0.1436] and 250 nM [t (df,4) = 1.077, P = 0.3420], but there was a notable decrease at 375 nM [t (df,4) = 6.125, (**)P = 0.0036]. (H) In contrast, WT cells treated with sbASO.miR-22 showed increased MeCP2 levels at 125 nM [t (df,4) = 5.096, (**)P = 0.0070], with no notable changes at 250 nM [t (df,4) = 0.9023, P = 0.4179] or 375 nM [t (df,4) = 1.176, P = 0.3049]. (C–I) sbASO.miR-132 led to higher MeCP2 expression in both (C) MT [125 nM [t (df,4) = 5.412, (**)P = 0.0056], 250 nM [t (df,4) = 2.883, (*)P = 0.0449]] and (I) WT [250 nM [t (df,4) = 18.14, (****)P < 0.0001], 375 nM [t (df,4) = 2.778, (*)P = 0.0499]] NSCs. No significant differences were detected at 375 nM [t (df,4) = 0.3510, P = 0.7433] in MT cells, or in WT NSCs at 125 nM [t (df,4) = 2.411, P = 0.0735]. (D–J) MeCP2 expression increased following sbASO.miR-483 treatment in (D) MT at the 125 nM [t (df,4) = 5.157, (**)P = 0.0067] and (J) WT NSCs at 250 nM [t (df,4) = 14.70, (***)P = 0.0001], and 375 nM [t (df,4) = 18.78, (***)P = 0.0003]. No significant changes were observed in MT NSCs at 250 nM [t (df,4) = 1.121, P = 0.3250] and 375 nM [t (df,4) = 1.364, P = 0.2443], or in WT NSCs at 125 nM [t (df,4) = 1.979, P = 0.1189].




