


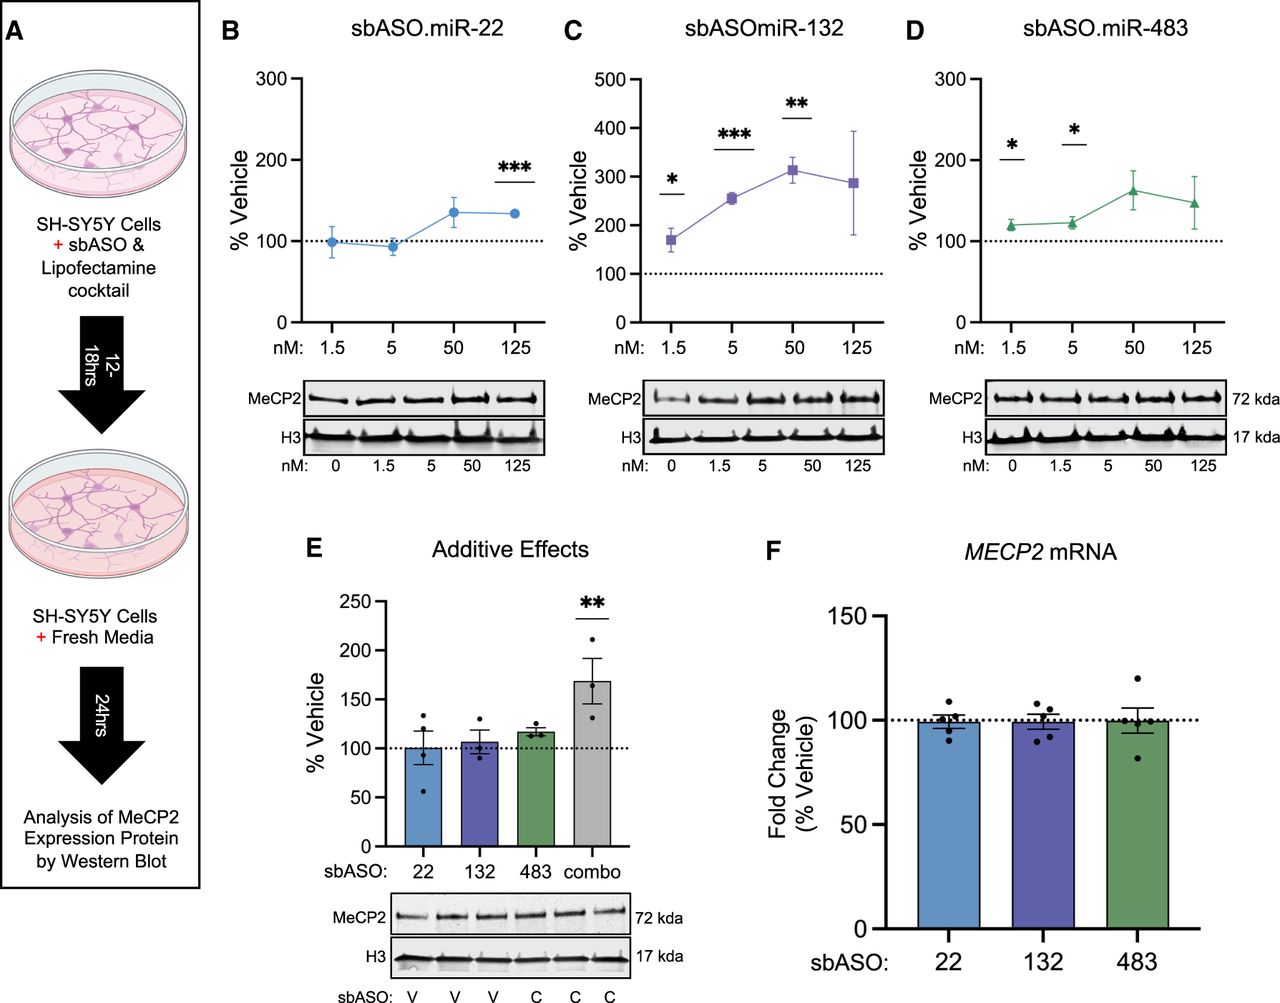
Dose-dependent increase of MeCP2 expression in SH-SY5Y cells. (A) Schematic of the experimental setup for evaluating the effect of sbASOs on SH-SY5Y neuroblastoma cells. (B–D) Western blot analysis showing the dose-dependent effects of sbASOs on MeCP2 protein levels. Quantification was normalized to Histone H3 (H3), with values represented as a percentage relative to vehicle treatment. (B) sbASO.miR-22 significantly increased MeCP2 levels at 125 nM ([***] P = 0.0002). (C) sbASO.miR-132 significantly increased MeCP2 levels at 1.5 nM ([*] P = 0.0468), 5 nM ([***] P = 0.0002), and 50 nM ([**] P = 0.0013). (D) sbASO.miR-483 increased MeCP2 levels at 1.5 nM ([*] P = 0.0462) and 5 nM ([*] P = 0.0375). Representative western blots showing the relative quantities of MeCP2 treated with different sbASO concentrations are located directly below each bar graph (the upper band representing MeCP2 [71 kDa] and the lower band representing H3 [17 kDa]). n = 3 per concentration per sbASO. (E) MeCP2 expression was further analyzed in SH-SY5Y cells transfected with subeffective concentrations of sbASOs (miR-22 = 5 nM, miR-483 = 1.5 nM, and miR-132 = 0.5 nM), demonstrating additive effects. V = vehicle, C = combined sbASOs. Statistical significance was determined using a two-way ANOVA with Tukey's post hoc test, (**) P < 0.01. n = 3–4 per sbASO. (F) MECP2 mRNA levels in sbASO-treated SH-SY5Y cells were measured via qRT-PCR after treatment with 50 nM sbASO.miR-22, sbASO.miR-132, and sbASO.miR-483. No significant changes in MECP2 mRNA levels were observed in response to sbASO treatment. n = 4–6 per sbASO. Outliers were identified and excluded using Grubb's test at α = 0.1. Data are presented as mean ± SEM.




